PNC Bank 2002 Annual Report Download - page 56
Download and view the complete annual report
Please find page 56 of the 2002 PNC Bank annual report below. You can navigate through the pages in the report by either clicking on the pages listed below, or by using the keyword search tool below to find specific information within the annual report.-
 1
1 -
2
-
3
-
4
-
5
-
6
-
7
-
8
-
9
-
10
-
11
-
12
-
13
-
14
-
15
-
16
-
17
-
18
-
19
-
20
-
21
-
22
-
23
-
24
-
25
-
26
-
27
-
28
-
29
-
30
-
31
-
32
-
33
-
34
-
35
-
36
-
37
-
38
-
39
-
40
-
41
-
42
-
43
-
44
-
45
-
 46
46 -
 47
47 -
 48
48 -
 49
49 -
 50
50 -
 51
51 -
 52
52 -
 53
53 -
 54
54 -
 55
55 -
 56
56 -
 57
57 -
 58
58 -
 59
59 -
 60
60 -
 61
61 -
 62
62 -
 63
63 -
 64
64 -
 65
65 -
 66
66 -
67
-
68
-
69
-
70
-
71
-
72
-
73
-
74
-
75
-
76
-
77
-
78
-
79
-
80
-
81
-
82
-
83
-
84
-
85
-
86
-
87
-
88
-
89
-
90
-
91
-
92
-
93
-
94
-
95
-
96
-
97
-
98
-
99
-
100
-
101
-
102
-
103
-
104
-
105
-
106
-
107
-
108
-
109
-
110
-
111
-
112
-
113
-
114
-
115
-
116
-
117
 |
 |

54
net interest income and its sensitivity to changes in interest
rates requires that the Corporation make assumptions about
the volume and characteristics of new business and the
behavior of existing positions. These business assumptions are
based on the Corporation’s experience, business plans and
published industry experience. Key assumptions employed in
the model include prepayment speeds on mortgage-related
assets and consumer loans, loan volumes and pricing, deposit
volumes and pricing, the expected life and repricing
characteristics of nonmaturity loans and deposits, and
management’s financial and capital plans.
Because these assumptions are inherently uncertain, the
model cannot precisely estimate net interest income or
precisely predict the effect of higher or lower interest rates on
net interest income. Actual results will differ from simulated
results due to the timing, magnitude and frequency of interest
rate changes, the difference between actual experience and the
assumed volume and characteristics of new business and
behavior of existing positions, and changes in market
conditions and management strategies, among other factors.
The Corporation models additional interest rate scenarios
covering a wider range of rate movements to identify yield
curve, term structure and basis risk exposures. These scenarios
are developed based on historical rate relationships or
management’s expectations regarding the future direction and
level of interest rates. Depending on market conditions and
other factors, these scenarios may be modeled more or less
frequently. Such analyses are used to identify risk and develop
strategies.
An economic value of equity model is used by the
Corporation to value all current on-balance-sheet and off-
balance-sheet positions under a range of instantaneous interest
rate changes. The resulting change in the value of equity is a
measure of overall long-term interest rate risk inherent in the
Corporation’s existing on-balance-sheet and off-balance-sheet
positions. The Corporation uses the economic value of equity
model to complement the net interest income simulation
modeling process.
The Corporation’s interest rate risk management policies
provide that net interest income should not decrease by more
than 3% if interest rates gradually increase or decrease from
current rates by 100 basis points over a twelve-month period
and that, in the subsequent year, net interest income should
not decrease by more than 6%. The policy further states that
the economic value of equity should not decrease by more
than 1.5% of the book value of assets for a 200 basis point
instantaneous increase or decrease in interest rates. In the
scenario with a 200 basis point decrease in interest rates, no
rates are reduced below zero.
At December 31, 2002, the Corporation’s exposure to a
100 basis point decline in interest rates in the second year
exceeds the approved policy limit. Consistent with the
Corporation’s policies, this exception has been reported to and
approved by the Finance Committee of the Board of
Directors. In the current low rate environment, management’s
actions have focused on reducing exposure to more modest
rate declines and on the effects of rate increases on net interest
income and the economic value of equity.
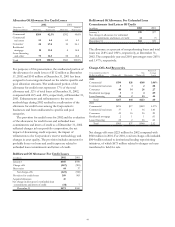
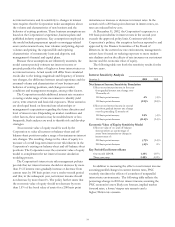
The following table sets forth the sensitivity results for the
last two years.
Interest Sensitivity Analysis
December 31 2002 2001
Net Interest Income Sensitivity Simulation
Effect on net interest income in first year
from gradual interest rate change over
12 months of:
100 basis point increase .4% (.3)%
100 basis point decrease (2.9)% (2.8)%
Effect on net interest income in second
year from gradual interest rate change
over the preceding 12 months of:
100 basis point increase 2.8% (.4)%
100 basis point decrease (11.4)% (9.4)%
Economic Value of Equity Sensitivity Model
Effect on value of on- and off-balance-
sheet positions as a percentage of
assets from instantaneous change in
interest rates of:
200 basis point increase (.7)% (1.4)%
200 basis point decrease (.4)% .5%
Key Period-End Interest Rates
One-month LIBO
R
1.38% 1.87%
Three-year swap 2.40% 4.33%
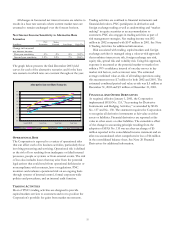
In addition to measuring the effect on net interest income
assuming parallel changes in current interest rates, PNC
routinely simulates the effects of a number of nonparallel
interest rate environments. The following table reflects the
percentage change in 2003 net interest income assuming the
PNC economist’s most likely rate forecast, implied market
forward rates, a lower/steeper rate scenario and a
higher/flatter rate scenario.