PNC Bank 2002 Annual Report Download - page 72
Download and view the complete annual report
Please find page 72 of the 2002 PNC Bank annual report below. You can navigate through the pages in the report by either clicking on the pages listed below, or by using the keyword search tool below to find specific information within the annual report.-
 1
1 -
2
-
3
-
4
-
5
-
6
-
7
-
8
-
9
-
10
-
11
-
12
-
13
-
14
-
15
-
16
-
17
-
18
-
19
-
20
-
21
-
22
-
23
-
24
-
25
-
26
-
27
-
28
-
29
-
30
-
31
-
32
-
33
-
34
-
35
-
36
-
37
-
38
-
39
-
40
-
41
-
42
-
43
-
44
-
45
-
46
-
47
-
48
-
49
-
50
-
51
-
52
-
53
-
54
-
55
-
56
-
57
-
58
-
59
-
60
-
61
-
 62
62 -
 63
63 -
 64
64 -
 65
65 -
 66
66 -
 67
67 -
 68
68 -
 69
69 -
 70
70 -
 71
71 -
 72
72 -
 73
73 -
 74
74 -
 75
75 -
 76
76 -
 77
77 -
 78
78 -
 79
79 -
 80
80 -
 81
81 -
 82
82 -
83
-
84
-
85
-
86
-
87
-
88
-
89
-
90
-
91
-
92
-
93
-
94
-
95
-
96
-
97
-
98
-
99
-
100
-
101
-
102
-
103
-
104
-
105
-
106
-
107
-
108
-
109
-
110
-
111
-
112
-
113
-
114
-
115
-
116
-
117
 |
 |

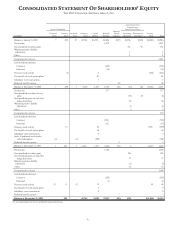
CONSOLIDATED STATEMENT OF SHAREHOLDERS’ EQUITY
THE PNC FINANCIAL SERVICES GROUP, INC.
70
Shares Outstanding
Accumulated Other
Comprehensive
Income (Loss) from
In millions
Preferred
Stock
Common
Stock
Preferred
Stock
Common
Stock
Capital
Surplus
Retained
Earnings
Deferred
Benefit
Expense
Continuing
Operations
Discontinued
Operations
Treasury
Stock Total
Balance at January 1, 2000 7 293 $7 $1,764 $1,276 $6,006 $(17) $(132) $(135) $(2,823) $5,946
Net income 1,279 1,279
Net unrealized securities gains 86 90 176
Minimum pension liability
adjustment 11
Other 22
Comprehensive income 1,458
Cash dividends declared
Common (530) (530)
Preferred (19) (19)
Treasury stock activity (3) 6 (218) (212)
Tax benefit of stock option plans 20 20
Subsidiary stock transactions 1 1
Deferred benefit expense (8) (8)
Balance at December 31, 2000 7 290 7 1,764 1,303 6,736 (25) (43) (45) (3,041) 6,656
Net income 377 377
Net unrealized securities (losses)
gains (51) 45 (6)
Net unrealized gains on cash flow
hedge derivatives 98 98
Minimum pension liability
adjustment (1) (1)
Other 22
Comprehensive income 470
Cash dividends declared
Common (552) (552)
Preferred (12) (12)
Treasury stock activity (7) 26 (516) (490)
Tax benefit of stock option plans 40 40
Subsidiary stock transactions 33
Series F preferred stock tender
offer/redemption (6) (6) (295) (301)
Deferred benefit expense 99
Balance at December 31, 2001 1 283 1 1,764 1,077 6,549 (16) 5 (3,557) 5,823
Net income 1,184 1,184
Net unrealized securities gains 265 265
Net unrealized gains on cash flow
hedge derivatives 37 37
Minimum pension liability
adjustment (2) (2)
Other 16 16
Comprehensive income 1,500
Cash dividends declared
Common (545) (545)
Preferred (1) (1)
Treasury stock activity (1) 2 (1) 13 52 64
Tax benefit of stock option plans 9 9
Subsidiary stock transactions 2 2
Deferred benefit expense 77
Balance at December 31, 2002 285 $1,764 $1,101 $7,187 $(9) $321 $(3,505) $6,859
See accompanying Notes To Consolidated Financial Statements.