PNC Bank 2002 Annual Report Download - page 44
Download and view the complete annual report
Please find page 44 of the 2002 PNC Bank annual report below. You can navigate through the pages in the report by either clicking on the pages listed below, or by using the keyword search tool below to find specific information within the annual report.-
 1
1 -
2
-
3
-
4
-
5
-
6
-
7
-
8
-
9
-
10
-
11
-
12
-
13
-
14
-
15
-
16
-
17
-
18
-
19
-
20
-
21
-
22
-
23
-
24
-
25
-
26
-
27
-
28
-
29
-
30
-
31
-
32
-
33
-
 34
34 -
 35
35 -
 36
36 -
 37
37 -
 38
38 -
 39
39 -
 40
40 -
 41
41 -
 42
42 -
 43
43 -
 44
44 -
 45
45 -
 46
46 -
 47
47 -
 48
48 -
 49
49 -
 50
50 -
 51
51 -
 52
52 -
 53
53 -
 54
54 -
55
-
56
-
57
-
58
-
59
-
60
-
61
-
62
-
63
-
64
-
65
-
66
-
67
-
68
-
69
-
70
-
71
-
72
-
73
-
74
-
75
-
76
-
77
-
78
-
79
-
80
-
81
-
82
-
83
-
84
-
85
-
86
-
87
-
88
-
89
-
90
-
91
-
92
-
93
-
94
-
95
-
96
-
97
-
98
-
99
-
100
-
101
-
102
-
103
-
104
-
105
-
106
-
107
-
108
-
109
-
110
-
111
-
112
-
113
-
114
-
115
-
116
-
117
 |
 |

42
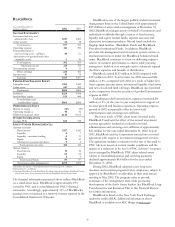
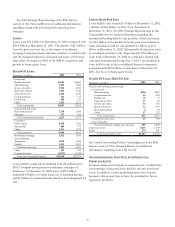
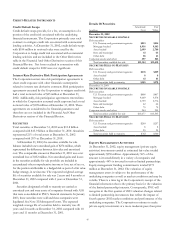
Nonperforming Assets By Type
December 31 - dollars in millions 2002 2001
Nonaccrual loans
Commercial $226 $188
Lease financing 57 11
Consumer 11 3
Commercial real estate 74
Residential mortgage 75
Total nonaccrual loans 308 211
Troubled debt restructured 1
Total nonperforming loans 309 211
Nonperforming loans held for sale (a) 97 169
Foreclosed assets
Commercial real estate 1
Residential mortgage 63
Other 67
Total foreclosed assets 12 11
Total nonperforming assets $418 $391
Nonperforming loans to total loans .87% .56%
Nonperforming assets to total loans, loans held
for sale and foreclosed assets 1.13 .93
Nonperforming assets to total assets .63 .56
(a) Includes troubled debt restructured loans held for sale of $17 million and
$6 million as of December 31, 2002 and 2001, respectively.
Of the total nonperforming loans at December 31, 2002 and
2001, approximately 41% and 47%, respectively, are related to
PNC Business Credit. These loans are to borrowers that often
are highly leveraged, experiencing rapid growth, or have
elected to utilize asset-based financing. As a result, the risk
profile of these loans typically reflects a higher risk of default
and a greater proportion of such loans being classified as
nonperforming. Such loans are secured by accounts receivable,
inventory, machinery and equipment, and other collateral. This
secured position helps to mitigate risk of loss on these loans
by reducing the reliance on cash flows for repayment. The
above table excludes $40 million and $18 million of
nonperforming equity management assets carried at estimated
fair value at December 31, 2002 and December 31, 2001 and
included in other assets on the Consolidated Balance Sheet.
Nonperforming equity management assets at December 31,
2002 include $12 million of troubled debt restructured assets.
The amount of nonperforming loans that were current as
to principal and interest was $107 million at December 31,
2002 and $93 million at December 31, 2001. The amount of
nonperforming loans held for sale that were current as to
principal and interest was $46 million at December 31, 2002
and $8 million at December 31, 2001.
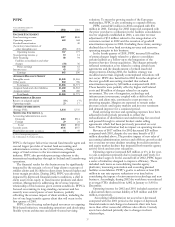
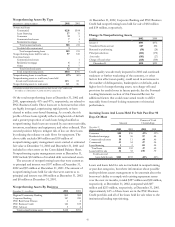
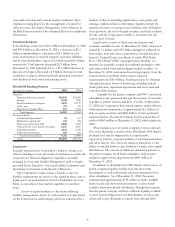
Nonperforming Assets By Business
December 31 – in millions 2002 2001
Regional Community Banking $82 $52
Corporate Banking 187 220
PNC Real Estate Finance 2 6
PNC Business Credit 142 109
PNC Advisors 5 4
Total nonperforming assets $418 $391
At December 31, 2002, Corporate Banking and PNC Business
Credit had nonperforming loans held for sale of $83 million
and $14 million, respectively.
Change In Nonperforming Assets
In millions 2002 2001
January 1 $391 $372
Transferred from accrual 887 852
Returned to performing (30) (28)
Principal reductions (421) (278)
Asset sales (181) (27)
Charge-offs and other (228) (500)
December 31 $418 $391
Credit quality was adversely impacted in 2002 and continued
weakness or further weakening of the economy, or other
factors that affect asset quality, could result in an increase in
the number of delinquencies, bankruptcies or defaults, and a
higher level of nonperforming assets, net charge-offs and
provision for credit losses in future periods. See the Forward-
Looking Statements section of this Financial Review for
additional factors that could cause actual results to differ
materially from forward-looking statements or historical
performance.
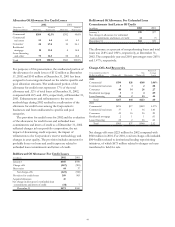
Accruing Loans And Loans Held For Sale Past Due 90
Days Or More
Amount
Percent of Total
Outstandings
December 31
Dollars in millions 2002 2001 2002 2001
Consumer $40 $36 .41% .39%
Residential mortgage 38 56 .97 .88
Commercial real estate 10 11 .44 .46
Commercial 41 54 .27 .36
Lease financing 12.02 .05
Total loans 130 159 .37 .42
Loans held for sale 32 33 1.99 .79
Total loans and
loans held for sale $162 $192 .44% .46%
Loans and loans held for sale not included in nonperforming
or past due categories, but where information about possible
credit problems causes management to be uncertain about the
borrower’s ability to comply with existing repayment terms
over the next six months, totaled $297 million and $38 million,
respectively, at December 31, 2002, compared with $87
million and $213 million, respectively, at December 31, 2001.
Approximately 44% of these loans are in the PNC Business
Credit portfolio and all of the loans held for sale relate to the
institutional lending repositioning.