PNC Bank 2002 Annual Report Download - page 111
Download and view the complete annual report
Please find page 111 of the 2002 PNC Bank annual report below. You can navigate through the pages in the report by either clicking on the pages listed below, or by using the keyword search tool below to find specific information within the annual report.-
 1
1 -
2
-
3
-
4
-
5
-
6
-
7
-
8
-
9
-
10
-
11
-
12
-
13
-
14
-
15
-
16
-
17
-
18
-
19
-
20
-
21
-
22
-
23
-
24
-
25
-
26
-
27
-
28
-
29
-
30
-
31
-
32
-
33
-
34
-
35
-
36
-
37
-
38
-
39
-
40
-
41
-
42
-
43
-
44
-
45
-
46
-
47
-
48
-
49
-
50
-
51
-
52
-
53
-
54
-
55
-
56
-
57
-
58
-
59
-
60
-
61
-
62
-
63
-
64
-
65
-
66
-
67
-
68
-
69
-
70
-
71
-
72
-
73
-
74
-
75
-
76
-
77
-
78
-
79
-
80
-
81
-
82
-
83
-
84
-
85
-
86
-
87
-
88
-
89
-
90
-
91
-
92
-
93
-
94
-
95
-
96
-
97
-
98
-
99
-
100
-
 101
101 -
 102
102 -
 103
103 -
 104
104 -
 105
105 -
 106
106 -
 107
107 -
 108
108 -
 109
109 -
 110
110 -
 111
111 -
 112
112 -
 113
113 -
 114
114 -
 115
115 -
 116
116 -
 117
117
 |
 |
109
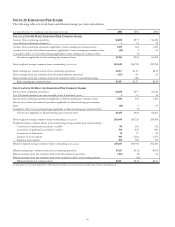
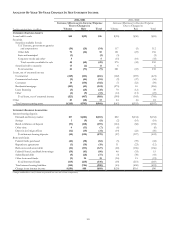
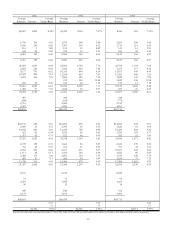
ANALYSIS OF YEAR-TO-YEAR CHANGES IN NET INTEREST INCOME
2002/2001 2001/2000
Increase/(Decrease) in Income/Expense
Due to Changes in:
Increase/(Decrease) in Income/Expense
Due to Changes in:
Taxable-equivalent basis - in millions Volume Rate Total Volume Rate Total
INTEREST-EARNING ASSETS
Loans held for sale $45 $(29) $16 $(35) $(50) $(85)
Securities
Securities available for sale
U.S. Treasury, government agencies
and corporations (34) (20) (54) 117 (5) 112
Other debt 76 (46) 30 181 (25) 156
State and municipal (1) (1) (3) (3)
Corporate stocks and other 55(15) (18) (33)
Total securities available for sale 48 (68) (20) 276 (44) 232
Securities held to maturity 13 (2) 11 66
Total securities 62 (71) (9) 281 (43) 238
Loans, net of unearned income
Commercial (245) (221) (466) (162) (259) (421)
Commercial real estate (9) (46) (55) (9) (47) (56)
Consumer 34 (136) (102) (7) (52) (59)
Residential mortgage (281) (43) (324) (275) 10 (265)
Lease financing (3) (25) (28) 70 (12) 58
Other (4) (9) (13) (14) (11) (25)
Total loans, net of unearned income (521) (467) (988) (399) (369) (768)
Other 81 (68) 13 24 (6) 18
Total interest-earning assets $(265) $(703) $(968) $(42) $(555) $(597)
INTEREST-BEARING LIABILITIES
Interest-bearing deposits
Demand and money market $17 $(282) $(265) $82 $(234) $(152)
Savings 1(9) (8) (2) (16) (18)
Retail certificates of deposit (91) (168) (259) (124) (68) (192)
Other time 4 (11) (7) (6) (6)
Deposits in foreign offices (12) (19) (31) (34) (22) (56)
Total interest-bearing deposits (45) (525) (570) (27) (397) (424)
Borrowed funds
Federal funds purchased (44) (38) (82) (5) (39) (44)
Repurchase agreements (1) (18) (19) 11 (23) (12)
Bank notes and senior debt (16) (111) (127) (60) (106) (166)
Federal Home Loan Bank borrowings (19) (61) (80) 48 (33) 15
Subordinated debt (9) (28) (37) (3) (38) (41)
Other borrowed funds (9) 24 15 (36) 15 (21)
Total borrowed funds (115) (215) (330) (18) (251) (269)
Total interest-bearing liabilities (144) (756) (900) (43) (650) (693)
Change in net interest income $(156) $88 $(68) $(20) $116 $96
Changes attributable to rate/volume are prorated into rate and volume components.