PNC Bank 2002 Annual Report Download - page 88
Download and view the complete annual report
Please find page 88 of the 2002 PNC Bank annual report below. You can navigate through the pages in the report by either clicking on the pages listed below, or by using the keyword search tool below to find specific information within the annual report.-
 1
1 -
2
-
3
-
4
-
5
-
6
-
7
-
8
-
9
-
10
-
11
-
12
-
13
-
14
-
15
-
16
-
17
-
18
-
19
-
20
-
21
-
22
-
23
-
24
-
25
-
26
-
27
-
28
-
29
-
30
-
31
-
32
-
33
-
34
-
35
-
36
-
37
-
38
-
39
-
40
-
41
-
42
-
43
-
44
-
45
-
46
-
47
-
48
-
49
-
50
-
51
-
52
-
53
-
54
-
55
-
56
-
57
-
58
-
59
-
60
-
61
-
62
-
63
-
64
-
65
-
66
-
67
-
68
-
69
-
70
-
71
-
72
-
73
-
74
-
75
-
76
-
77
-
 78
78 -
 79
79 -
 80
80 -
 81
81 -
 82
82 -
 83
83 -
 84
84 -
 85
85 -
 86
86 -
 87
87 -
 88
88 -
 89
89 -
 90
90 -
 91
91 -
 92
92 -
 93
93 -
 94
94 -
 95
95 -
 96
96 -
 97
97 -
 98
98 -
99
-
100
-
101
-
102
-
103
-
104
-
105
-
106
-
107
-
108
-
109
-
110
-
111
-
112
-
113
-
114
-
115
-
116
-
117
 |
 |

86
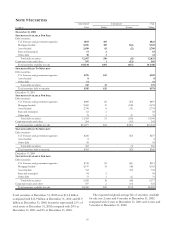
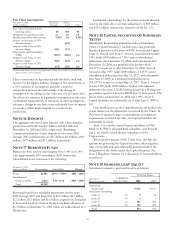
The securities classified as held to maturity are carried at
amortized cost and were owned by companies formed with
American International Group, Inc. (“AIG”) in 2001 that were
consolidated in PNC’s financial statements. In January 2003,
these securities were sold and these companies were
liquidated. See Note 32 Subsequent Events.
The expected weighted-average life of securities held to
maturity was 20 years and 2 months at December 31, 2002 and
18 years and 11 months at December 31, 2001. PNC had no
securities held for maturity at December 31, 2000.
At December 31, 2002, the securities available for sale
balance included a net unrealized gain of $274 million, which
represented the difference between fair value and amortized
cost. The comparable amounts at December 31, 2001 and
December 31, 2000 were net unrealized losses of $132 million
and $54 million, respectively. Net unrealized gains and losses
in the securities available for sale portfolio are included in
shareholders’ equity as accumulated other comprehensive
income or loss, net of tax or, for the portion attributable to
changes in a hedged risk as part of a fair value hedge strategy,
in net income.
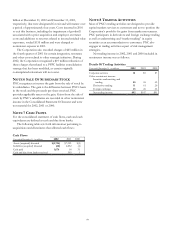
Net securities gains were $89 million in 2002, $128 million
in 2001 and $29 million in 2000. Net securities gains for 2001
and 2000 included $3 million of net securities losses and $9
million of net securities gains, respectively, related to
commercial mortgage banking activities that were reported in
corporate services revenue. There were no comparable
amounts in 2002.
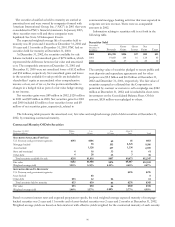
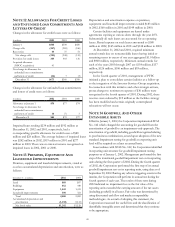
Information relating to securities sold is set forth in the
following table.
Securities Sold
Year ended
December 31
In millions Proceeds
Gross
Gains
Gross
Losses
Net
Gains Taxes
2002 $16,395 $106 $17 $89 $31
2001 19,693 144 16 128 45
2000 7,630 37 8 29 10
The carrying value of securities pledged to secure public and
trust deposits and repurchase agreements and for other
purposes was $9.5 billion and $6.2 billion at December 31,
2002 and December 31, 2001, respectively. The fair value of
securities accepted as collateral that the Corporation is
permitted by contract or custom to sell or repledge was $582
million at December 31, 2002, and is included in short-term
investments on the Consolidated Balance Sheet. Of this
amount, $524 million was repledged to others.
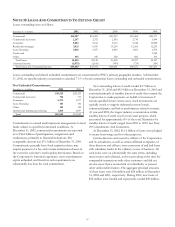
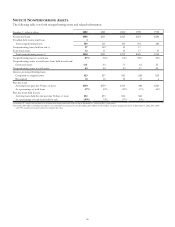
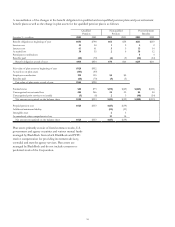
The following table presents the amortized cost, fair value and weighted-average yield of debt securities at December 31,
2002, by remaining contractual maturity.
Contractual Maturity Of Debt Securities
December 31, 2002 Within 1 to 5 to After 10
Dollars in millions 1 Year 5 Years 10 Years Years Total
SECURITIES AVAILABLE FOR SALE
U.S. Treasury and government agencies $193 $606 $9 $5 $813
Mortgage-backed 38 555 8,323 8,916
Asset-backed 1,128 237 1,334 2,699
State and municipal 418 33 661
Other debt 428 23 358
Total securities available for sale $201 $1,818 $857 $9,671 $12,547
Fair value $202 $1,908 $876 $9,847 $12
,
833
Weighted-average yield 1.35% 5.34% 4.22% 4.65% 4.67%
SECURITIES HELD
T
O M
A
TURIT
Y
U.S. Treasury and government agencies $276 $276
Asset-backed $8 8
Other debt $33 22 $6 61
Total securities held to maturity $33 $30 $6 $276 $345
Fair value $33 $30 $6 $309 $378
Weighted-average yield 1.48% 1.57% 5.88% 5.77% 4.99%
Based on current interest rates and expected prepayment speeds, the total weighted-average expected maturity of mortgage-
backed securities was 2 years and 11 months and of asset-backed securities was 2 years and 2 months at December 31, 2002.
Weighted-average yields are based on historical cost with effective yields weighted for the contractual maturity of each security.