PNC Bank 2002 Annual Report Download - page 29
Download and view the complete annual report
Please find page 29 of the 2002 PNC Bank annual report below. You can navigate through the pages in the report by either clicking on the pages listed below, or by using the keyword search tool below to find specific information within the annual report.-
 1
1 -
2
-
3
-
4
-
5
-
6
-
7
-
8
-
9
-
10
-
11
-
12
-
13
-
14
-
15
-
16
-
17
-
18
-
 19
19 -
 20
20 -
 21
21 -
 22
22 -
 23
23 -
 24
24 -
 25
25 -
 26
26 -
 27
27 -
 28
28 -
 29
29 -
 30
30 -
 31
31 -
 32
32 -
 33
33 -
 34
34 -
 35
35 -
 36
36 -
 37
37 -
 38
38 -
 39
39 -
40
-
41
-
42
-
43
-
44
-
45
-
46
-
47
-
48
-
49
-
50
-
51
-
52
-
53
-
54
-
55
-
56
-
57
-
58
-
59
-
60
-
61
-
62
-
63
-
64
-
65
-
66
-
67
-
68
-
69
-
70
-
71
-
72
-
73
-
74
-
75
-
76
-
77
-
78
-
79
-
80
-
81
-
82
-
83
-
84
-
85
-
86
-
87
-
88
-
89
-
90
-
91
-
92
-
93
-
94
-
95
-
96
-
97
-
98
-
99
-
100
-
101
-
102
-
103
-
104
-
105
-
106
-
107
-
108
-
109
-
110
-
111
-
112
-
113
-
114
-
115
-
116
-
117
 |
 |

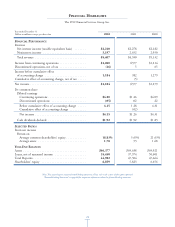
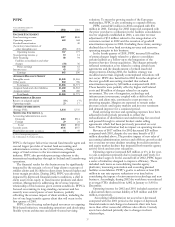
27
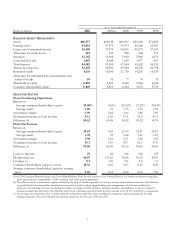
At or Year ended December 31
Dollars in millions 2002 2001(a) 2000 1999 1998
BALANCE SHEET HIGHLIGHTS
Assets $66,377 $69,638 $69,921 $69,360 $70,829
Earning assets 54,833 57,875 59,373 60,268 63,547
Loans, net of unearned income 35,450 37,974 50,601 49,673 57,633
Allowance for credit losses 673 560 598 600 678
Securities 13,763 13,908 5,902 5,960 4,472
Loans held for sale 1,607 4,189 1,655 3,477 467
Total deposits 44,982 47,304 47,664 45,802 46,150
Transaction deposits 32,349 32,590 29,922 26,538 26,798
Borrowed funds 9,116 12,090 11,718 14,229 15,939
Allowance for unfunded loan commitments and
letters of credi
t
84 70 77 74 75
Shareholders’ equity 6,859 5,823 6,656 5,946 6,043
Common shareholders’ equity 6,849 5,813 6,344 5,633 5,729
SELECTED RATIOS
From Continuing Operations
Return on
Average common shareholders’ equity 19.08% 5.65% 20.52% 21.29% 20.14%
Average assets 1.80 .53 1.76 1.76 1.55
Net interest margin 3.99 3.84 3.64 3.86 3.99
Noninterest income to total revenue 59.1 53.8 57.5 51.0 45.4
Efficiency (b) 58.62 65.48 56.82 55.32 54.74
From Net Income
Return on
Average common shareholders’ equity 18.83 5.65 21.63 22.41 20.81
Average assets 1.78 .53 1.68 1.69 1.49
Net interest margin 3.99 3.81 3.37 3.68 3.85
Noninterest income to total revenue 59.1 53.9 59.7 52.9 47.0
Efficiency (b) 59.08 65.36 55.16 54.63 54.69
Loans to deposits 79 80 106 108 125
Dividend payout 46.07 151.65 42.06 40.22 43.43
Leverage (c) 8.1 6.8 8.0 6.6 7.3
Common shareholders’ equity to assets 10.32 8.35 9.07 8.12 8.09
Average common shareholders’ equity to average
assets 9.44 9.14 8.44 8.12 7.56
(a) See 2001 Strategic Repositioning in the Consolidated Balance Sheet Review section of this Financial Review for further information regarding
items impacting the comparability of 2001 amounts with other periods presented.
(b) The efficiency ratio is noninterest expense divided by the sum of taxable-equivalent net interest income and noninterest income. Amortization
of goodwill and other intangibles, distributions on capital securities and mortgage banking risk management activities are excluded for
purposes of computing this ratio. Excluding the impact of charges in 2001 related to strategic initiatives and additions to reserves related to
insured residual value exposures, the efficiency ratios from continuing operations and from net income were 58.14% and 58.07%, respectively.
(c) The leverage ratio represents Tier 1 capital divided by adjusted average total assets as defined by regulatory capital requirements for bank
holding companies. The ratio includes discontinued operations for the years 1998 and 1999.