PNC Bank 2002 Annual Report Download - page 48
Download and view the complete annual report
Please find page 48 of the 2002 PNC Bank annual report below. You can navigate through the pages in the report by either clicking on the pages listed below, or by using the keyword search tool below to find specific information within the annual report.-
 1
1 -
2
-
3
-
4
-
5
-
6
-
7
-
8
-
9
-
10
-
11
-
12
-
13
-
14
-
15
-
16
-
17
-
18
-
19
-
20
-
21
-
22
-
23
-
24
-
25
-
26
-
27
-
28
-
29
-
30
-
31
-
32
-
33
-
34
-
35
-
36
-
37
-
 38
38 -
 39
39 -
 40
40 -
 41
41 -
 42
42 -
 43
43 -
 44
44 -
 45
45 -
 46
46 -
 47
47 -
 48
48 -
 49
49 -
 50
50 -
 51
51 -
 52
52 -
 53
53 -
 54
54 -
 55
55 -
 56
56 -
 57
57 -
 58
58 -
59
-
60
-
61
-
62
-
63
-
64
-
65
-
66
-
67
-
68
-
69
-
70
-
71
-
72
-
73
-
74
-
75
-
76
-
77
-
78
-
79
-
80
-
81
-
82
-
83
-
84
-
85
-
86
-
87
-
88
-
89
-
90
-
91
-
92
-
93
-
94
-
95
-
96
-
97
-
98
-
99
-
100
-
101
-
102
-
103
-
104
-
105
-
106
-
107
-
108
-
109
-
110
-
111
-
112
-
113
-
114
-
115
-
116
-
117
 |
 |

46
years and consistent with current market conditions. More
emphasis is being placed on the management of capital for
other investors. See Equity Management Asset Valuation in
the Risk Factors section of this Financial Review for additional
information.
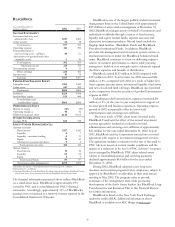
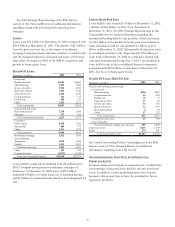
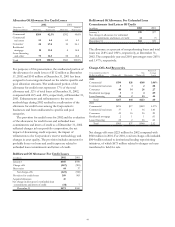
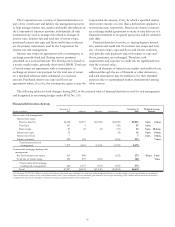
FUNDING SOURCES
Total funding sources were $54.1 billion at December 31, 2002
and $59.4 billion at December 31, 2001, a decrease of $5.3
billion corresponding to a decrease of $3.3 billion in total
assets and increases in accrued expenses and other liabilities
and in total shareholders’ equity of $.9 billion and $1.0 billion,
respectively. Total deposits decreased $2.3 billion from
December 31, 2001 primarily due to a $1.1 billion decrease in
deposits in foreign offices and a $.9 billion decrease in retail
certificates of deposit. Borrowed funds decreased consistent
with declines in total assets and earning assets.
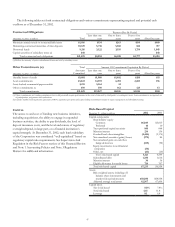
Details Of Funding Sources
December 31 - in millions 2002 2001
Deposits
Demand and money market $32,349 $32,589
Savings 2,014 1,942
Retail certificates of deposit 9,839 10,727
Other time 317 472
Deposits in foreign offices 463 1,574
Total deposits 44,982 47,304
Borrowed funds
Federal funds purchased 38 167
Repurchase agreements 814 954
Bank notes and senior debt 4,400 6,362
Federal Home Loan Bank borrowings 1,256 2,047
Subordinated debt 2,423 2,298
Other borrowed funds 185 262
Total borrowed funds 9,116 12,090
Total $54,098 $59,394
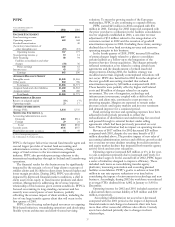
LIQUIDITY
Liquidity represents the Corporation’s ability to obtain cost-
effective funding to meet the needs of customers as well as the
Corporation’s financial obligations. Liquidity is centrally
managed by Asset and Liability Management, with oversight
provided by the Executive Asset and Liability Committee and
the Finance Committee of the Board of Directors.
The Corporation’s main sources of funds to meet its
liquidity requirements are access to the capital markets, sale of
liquid assets, secured advances from the Federal Home Loan
Bank, its core deposit base and the capability to securitize
assets.
Access to capital markets is a key factor affecting
liquidity management. Access to such markets is in part based
on the Corporation’s credit ratings, which are influenced by a
number of factors including capital ratios, asset quality and
earnings. Additional factors that impact liquidity include the
maturity structure of existing assets, liabilities, and off-balance-
sheet positions, the level of liquid securities and loans available
for sale, and the Corporation’s ability to securitize and sell
various types of loans.
Liquid assets consist of short-term investments and
securities available for sale. At December 31, 2002, such assets
totaled $17.1 billion, with $9.5 billion pledged as collateral for
borrowings, trust and other commitments. Secured advances
from the Federal Home Loan Bank, of which PNC Bank,
N.A. (“PNC Bank”) PNC’s principal bank subsidiary, is a
member, are generally secured by residential mortgages, other
real-estate related loans and mortgage-backed securities. At
December 31, 2002, total unused borrowing capacity from the
Federal Home Loan Bank under current collateral
requirements was $10.0 billion. Funding can also be obtained
through alternative forms of borrowing, including federal
funds purchased, repurchase agreements and short-term and
long-term debt issuance.
Liquidity for the parent company and PNC’s non-bank
subsidiaries is also generated through the issuance of securities
in public or private markets and lines of credit. At December
31, 2002, the Corporation had unused capacity under effective
shelf registration statements of approximately $3.3 billion of
debt or equity securities and $400 million of trust preferred
capital securities. The parent company had an unused line of
credit of $460 million at December 31, 2002, which expires in
2003.
The principal source of parent company revenue and cash
flow is the dividends it receives from PNC Bank. PNC Bank’s
dividend level may be impacted by its capital needs,
supervisory policies, corporate policies, contractual restrictions
and other factors. Also, there are statutory limitations on the
ability of national banks to pay dividends or make other capital
distributions. The amount available for dividend payments to
the parent company by all bank subsidiaries without prior
regulatory approval was approximately $460 million at
December 31, 2002.
In addition to dividends from PNC Bank, other sources of
parent company liquidity include cash and short-term
investments, as well as dividends and loan repayments from
other subsidiaries. As of December 31, 2002, the parent
company had approximately $719 million in funds available
from its cash and short-term investments or other funds
available from unrestricted subsidiaries. Management expects
that the parent company will have sufficient liquidity available
to meet current obligations to its debt holders, vendors, and
others and to pay dividends at current rates through 2003.