PNC Bank 2002 Annual Report Download - page 36
Download and view the complete annual report
Please find page 36 of the 2002 PNC Bank annual report below. You can navigate through the pages in the report by either clicking on the pages listed below, or by using the keyword search tool below to find specific information within the annual report.-
 1
1 -
2
-
3
-
4
-
5
-
6
-
7
-
8
-
9
-
10
-
11
-
12
-
13
-
14
-
15
-
16
-
17
-
18
-
19
-
20
-
21
-
22
-
23
-
24
-
25
-
 26
26 -
 27
27 -
 28
28 -
 29
29 -
 30
30 -
 31
31 -
 32
32 -
 33
33 -
 34
34 -
 35
35 -
 36
36 -
 37
37 -
 38
38 -
 39
39 -
 40
40 -
 41
41 -
 42
42 -
 43
43 -
 44
44 -
 45
45 -
 46
46 -
47
-
48
-
49
-
50
-
51
-
52
-
53
-
54
-
55
-
56
-
57
-
58
-
59
-
60
-
61
-
62
-
63
-
64
-
65
-
66
-
67
-
68
-
69
-
70
-
71
-
72
-
73
-
74
-
75
-
76
-
77
-
78
-
79
-
80
-
81
-
82
-
83
-
84
-
85
-
86
-
87
-
88
-
89
-
90
-
91
-
92
-
93
-
94
-
95
-
96
-
97
-
98
-
99
-
100
-
101
-
102
-
103
-
104
-
105
-
106
-
107
-
108
-
109
-
110
-
111
-
112
-
113
-
114
-
115
-
116
-
117
 |
 |

34
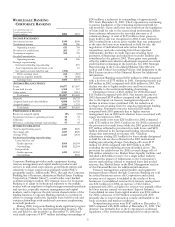
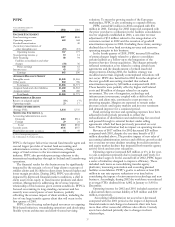
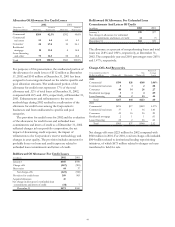
WHOLESALE BANKING
PNC BUSINESS CREDIT
Year ended December 31
Taxable-equivalent basis
Dollars in millions 2002 2001
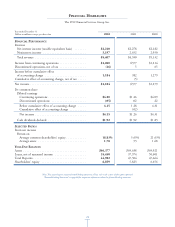
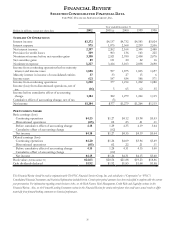
INCOME STATEMENT
Net interest income $134 $104
Noninterest income 59 30
Operating revenue 193 134
Provision for credit losses 64 19
Noninterest expense 53 29
Goodwill amortization 2
Operating income 76 84
Strategic repositioning:
Institutional lending repositioning 48
Net losses on loans held for sale 11
Pretax earnings 65 36
Income taxes 25 14
Earnings $40 $22
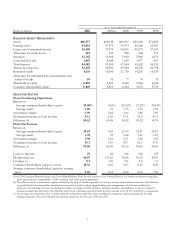
AVERAGE BALANCE SHEET
Loans $3,535 $2,331
Loans held for sale 68 72
Other assets 234 60
Total assets $3,837 $2,463
Deposits $84 $77
Assigned funds and other liabilities 3,503 2,223
Assigned capital 250 163
Total funds $3,837 $2,463
PERFORMANCE RATIOS
Return on assigned capital 16% 13%
Noninterest income to operating revenue 31 22
Efficiency 29 30
Efficiency, excluding strategic repositioning 27 22
OTHER INFORMATION
Total nonperforming assets $142 $109
Net charge-offs $32 $19
Marketing locations 23 14
Average FTEs 241 137
Institutional lending repositioning
Loans held for sale
Credit exposure $13 $40
Outstandings $9 $30
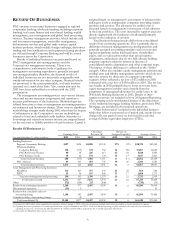
PNC Business Credit provides asset-based lending, treasury
management and capital markets products and services to
middle market customers nationally. PNC Business Credit’s
lending services include loans secured by accounts receivable,
inventory, machinery and equipment, and other collateral, and
its customers include manufacturing, wholesale, distribution,
retailing and service industry companies.
In January 2002, PNC Business Credit acquired a portion of
NBOC’s U.S. asset-based lending business in a purchase
business combination. See Note 2 NBOC Acquisition for
additional information.
PNC Business Credit earned $40 million in 2002 compared
with $22 million in 2001. Operating income for 2002 was $76
million compared with $84 million in 2001. Operating income
for 2002 included revenue and expense resulting from the
NBOC acquisition and a $28 million benefit resulting from a
reduction in the NBOC put option liability. The impact of
these items was more than offset by an increase of $45 million
in the provision for credit losses.
Operating revenue was $193 million for 2002, a $59 million
increase compared with 2001 as both net interest income and
noninterest income increased. The increase in net interest
income for 2002 reflected a net increase of $1.2 billion or 52%
in total average loans for the period resulting primarily from
the NBOC acquisition. Noninterest income for 2002 included
a $28 million benefit resulting from a reduction in the put
option liability related to the NBOC acquisition. Noninterest
income for 2001 included gains on sales of equity interests
received as compensation in conjunction with lending
relationships. There were no such gains in 2002.
The provision for credit losses for 2002 was $64 million
compared with $19 million for 2001. Net charge-offs were $32
million for 2002 compared with $19 million a year ago. The
provision for credit losses increased in 2002 as additions to
reserves were made due to a decline in credit quality and the
impact of refinements to the Corporation’s reserve
methodology related to impaired loans and pooled reserves.
PNC Business Credit loans, including those acquired in the
NBOC acquisition, are secured loans to borrowers, many who
are highly leveraged, experiencing rapid growth, or have
elected to utilize asset-based financing. As a result, the risk
profile of these loans typically reflects a higher risk of default
and a greater proportion being classified as nonperforming.
The impact of these loans on the provision for credit losses
and the level of nonperforming assets may be even more
pronounced during periods of economic downturn consistent
with PNC Business Credit’s recent experience. PNC Business
Credit attempts to manage this risk through the stringent
control of the borrowers’ collateral. Therefore, net charge-offs
on asset-based loans have historically been relatively low due
to recoveries provided by the underlying collateral.
Compensation for this higher risk of default is obtained by
way of higher interest rates charged.
Total noninterest expense increased $24 million to $53
million for 2002 primarily due to costs added with the NBOC
acquisition.
Nonperforming assets were $142 million at December 31,
2002 compared with $109 million at December 31, 2001. The
increase was primarily due to the transfer of a single credit to
nonperforming status that was partially offset by reductions to
credits through managed liquidation and run-offs.
PNC Business Credit’s balance sheet included several
credits that were part of the Corporation’s institutional lending
repositioning. Credit exposure of $13 million, including $9
million of outstandings classified as held for sale, remained at
December 31, 2002.