PNC Bank 2002 Annual Report Download - page 114
Download and view the complete annual report
Please find page 114 of the 2002 PNC Bank annual report below. You can navigate through the pages in the report by either clicking on the pages listed below, or by using the keyword search tool below to find specific information within the annual report.-
 1
1 -
2
-
3
-
4
-
5
-
6
-
7
-
8
-
9
-
10
-
11
-
12
-
13
-
14
-
15
-
16
-
17
-
18
-
19
-
20
-
21
-
22
-
23
-
24
-
25
-
26
-
27
-
28
-
29
-
30
-
31
-
32
-
33
-
34
-
35
-
36
-
37
-
38
-
39
-
40
-
41
-
42
-
43
-
44
-
45
-
46
-
47
-
48
-
49
-
50
-
51
-
52
-
53
-
54
-
55
-
56
-
57
-
58
-
59
-
60
-
61
-
62
-
63
-
64
-
65
-
66
-
67
-
68
-
69
-
70
-
71
-
72
-
73
-
74
-
75
-
76
-
77
-
78
-
79
-
80
-
81
-
82
-
83
-
84
-
85
-
86
-
87
-
88
-
89
-
90
-
91
-
92
-
93
-
94
-
95
-
96
-
97
-
98
-
99
-
100
-
101
-
102
-
103
-
 104
104 -
 105
105 -
 106
106 -
 107
107 -
 108
108 -
 109
109 -
 110
110 -
 111
111 -
 112
112 -
 113
113 -
 114
114 -
 115
115 -
 116
116 -
 117
117
 |
 |

112
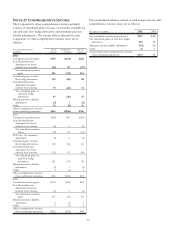
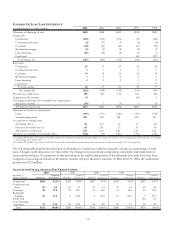
SUMMARY OF LOAN LOSS EXPERIENCE
Year ended December 31 - dollars in millions 2002 2001 2000 1999 1998
Allowance at beginning of year $560 $598 $600 $678 $882
Charge-offs
Commercial (194) (876) (121) (72) (122)
Commercial real estate (3) (37) (3) (4) (8)
Consumer (40) (42) (46) (63) (83)
Residential mortgage (5) (2) (8) (8) (7)
Lease financing (25) (28) (8) (9) (7)
Credit card (60) (297)
Total charge-offs (267) (985) (186) (216) (524)
Recoveries
Commercial 26 17 21 22 20
Commercial real estate 114 4 3
Consumer 14 16 22 25 34
Residential mortgage 112 1 1
Lease financing 222 1 2
Credit card 217
Total recoveries 44 37 51 55 77
Net charge-offs (223) (948) (135) (161) (447)
Provision for credit losses 309 903 136 163 225
Acquisitions/(divestitures) 41 (81) 3
Net change in allowance for unfunded loan commitments
and letters of credit (14) 7(3) 1 15
Allowance at end of year $673 $560 $598 $600 $678
Allowance as a percent of period-end
Loans 1.90% 1.47% 1.18% 1.21% 1.18%
Nonperforming loans 218 265 185 206 237
As a percent of average loans
Net charge-offs (a) .60 2.12 .27 .31 .80
Provision for credit losses (b) .83 2.01 .27 .31 .40
Allowance for credit losses 1.81 1.25 1.20 1.14 1.22
A
llowance as a multiple of net charge-offs (a) 3.02x .59x 4.43x 3.73x 1.52x
(a) Excluding $804 million of net charge-offs in 2001 related to the institutional lending repositioning initiative, net charge-offs would be .32% of average loans and the allowance as a multiple
of net charge-offs would be 3.89x.
(b) Excluding $714 million of provision in 2001 related to the institutional lending repositioning initiative, provision for credit losses would be .42% of average loans.
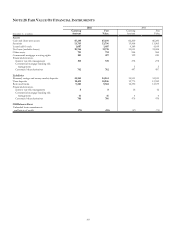
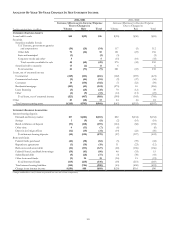
The following table presents the allocation of allowance for credit losses and the categories of loans as a percentage of total
loans. Changes in the allocation over time reflect the changes in loan portfolio composition, risk profile and refinements to
reserve methodologies. For purposes of this presentation, the unallocated portion of the allowance for credit losses has been
assigned to loan categories based on the relative specific and pool allocation amounts. At December 31, 2002, the unallocated
portion was $112 million.
ALLOCATION OF ALLOWANCE FOR CREDIT LOSSES
2002 2001 2000 1999 1998
December 31
Dollars in millions Allowance
Loans to
Total Loans Allowance
Loans to
Total Loans Allowance
Loans to
Total Loans Allowance
Loans to
Total Loans Allowance
Loans to
Total Loans
Commercial $504 42.3% $392 40.0% $467 41.9% $447 43.2% $393 43.7%
Commercial real
estate 52 6.4 63 6.3 44 5.1 52 5.5 50 6.0
Consumer 28 27.8 39 24.1 43 18.0 51 18.8 65 19.0
Residential
mortgage 10 11.0 8 16.8 9 26.2 11 25.2 9 21.3
Credit card 136 5.1
Lease financing
and other 79 12.5 58 12.8 35 8.8 39 7.3 25 4.9
T
otal $673 100.0% $560 100.0% $598 100.0% $600 100.0% $678 100.0%