PNC Bank 2002 Annual Report Download - page 101
Download and view the complete annual report
Please find page 101 of the 2002 PNC Bank annual report below. You can navigate through the pages in the report by either clicking on the pages listed below, or by using the keyword search tool below to find specific information within the annual report.-
 1
1 -
2
-
3
-
4
-
5
-
6
-
7
-
8
-
9
-
10
-
11
-
12
-
13
-
14
-
15
-
16
-
17
-
18
-
19
-
20
-
21
-
22
-
23
-
24
-
25
-
26
-
27
-
28
-
29
-
30
-
31
-
32
-
33
-
34
-
35
-
36
-
37
-
38
-
39
-
40
-
41
-
42
-
43
-
44
-
45
-
46
-
47
-
48
-
49
-
50
-
51
-
52
-
53
-
54
-
55
-
56
-
57
-
58
-
59
-
60
-
61
-
62
-
63
-
64
-
65
-
66
-
67
-
68
-
69
-
70
-
71
-
72
-
73
-
74
-
75
-
76
-
77
-
78
-
79
-
80
-
81
-
82
-
83
-
84
-
85
-
86
-
87
-
88
-
89
-
90
-
 91
91 -
 92
92 -
 93
93 -
 94
94 -
 95
95 -
 96
96 -
 97
97 -
 98
98 -
 99
99 -
 100
100 -
 101
101 -
 102
102 -
 103
103 -
 104
104 -
 105
105 -
 106
106 -
 107
107 -
 108
108 -
 109
109 -
 110
110 -
 111
111 -
112
-
113
-
114
-
115
-
116
-
117
 |
 |

99
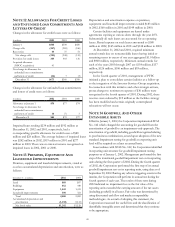
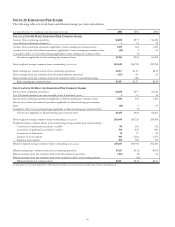
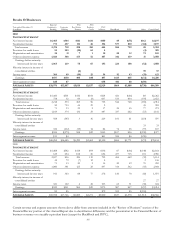
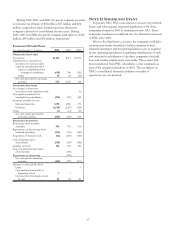
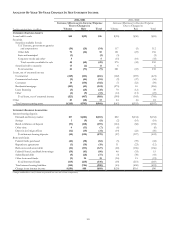
NOTE 25 EARNINGS PER SHARE
The following table sets forth basic and diluted earnings per share calculations.
Year ended December 31 - in millions, except share and per share data 2002 2001 2000
CALCULATION OF BASIC EARNINGS PER COMMON SHARE
Income from continuing operations $1,200 $377 $1,214
Less: Preferred dividends declared (a) 113 19
Income from continuing operations applicable to basic earnings per common share 1,199 364 1,195
Income (loss) from discontinued operations applicable to basic earnings per common share (16) 565
Cumulative effect of accounting change applicable to basic earnings per common share (5)
Net income applicable to basic earnings per common share $1,183 $364 $1,260
Basic weighted-average common shares outstanding (in thousands) 283,449 286,726 289,958
Basic earnings per common share from continuing operations $4.23 $1.27 $4.12
Basic earnings (loss) per common share from discontinued operations (.05) .02 .23
Basic earnings (loss) per common share from cumulative effect of accounting change (.02)
Basic earnings per common share $4.18 $1.27 $4.35
CALCULATION OF DILUTED EARNINGS PER COMMON SHARE
Income from continuing operations $1,200 $377 $1,214
Less: Dividends declared on nonconvertible Series F preferred stock (a) 113 18
Income from continuing operations applicable to diluted earnings per common share 1,199 364 1,196
Income (loss) from discontinued operations applicable to diluted earnings per common
share (16) 565
Cumulative effect of accounting change applicable to diluted earnings per common share (5)
Net income applicable to diluted earnings per common share $1,183 $364 $1,261
Basic weighted-average common shares outstanding (in thousands) 283,449 286,726 289,958
Weighted-average common shares to be issued using average market price and assuming:
Conversion of preferred stock Series A and B 98 106 118
Conversion of preferred stock Series C and D 795 870 986
Conversion of debentures 16 17 20
Exercise of stock options 496 1,661 1,531
Incentive share awards 299 368 173
Diluted weighted-average common shares outstanding (in thousands) 285,153 289,748 292,786
Diluted earnings per common share from continuing operations $4.20 $1.26 $4.09
Diluted earnings (loss) per common share from discontinued operations (.05) .02 .22
Diluted earnings (loss) per common share from cumulative effect of accounting change (.02)
Diluted earnings per common share $4.15 $1.26 $4.31
(a) Adjustment for year ended December 31, 2001 includes $1 million of cost incurred due to tender offer of Series F preferred stock.