PNC Bank 2002 Annual Report Download - page 110
Download and view the complete annual report
Please find page 110 of the 2002 PNC Bank annual report below. You can navigate through the pages in the report by either clicking on the pages listed below, or by using the keyword search tool below to find specific information within the annual report.-
 1
1 -
2
-
3
-
4
-
5
-
6
-
7
-
8
-
9
-
10
-
11
-
12
-
13
-
14
-
15
-
16
-
17
-
18
-
19
-
20
-
21
-
22
-
23
-
24
-
25
-
26
-
27
-
28
-
29
-
30
-
31
-
32
-
33
-
34
-
35
-
36
-
37
-
38
-
39
-
40
-
41
-
42
-
43
-
44
-
45
-
46
-
47
-
48
-
49
-
50
-
51
-
52
-
53
-
54
-
55
-
56
-
57
-
58
-
59
-
60
-
61
-
62
-
63
-
64
-
65
-
66
-
67
-
68
-
69
-
70
-
71
-
72
-
73
-
74
-
75
-
76
-
77
-
78
-
79
-
80
-
81
-
82
-
83
-
84
-
85
-
86
-
87
-
88
-
89
-
90
-
91
-
92
-
93
-
94
-
95
-
96
-
97
-
98
-
99
-
 100
100 -
 101
101 -
 102
102 -
 103
103 -
 104
104 -
 105
105 -
 106
106 -
 107
107 -
 108
108 -
 109
109 -
 110
110 -
 111
111 -
 112
112 -
 113
113 -
 114
114 -
 115
115 -
 116
116 -
 117
117
 |
 |

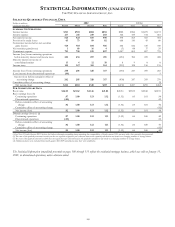
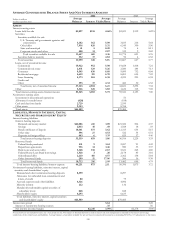
STATISTICAL INFORMATION (UNAUDITED)
THE PNC FINANCIAL SERVICES GROUP, INC.
108
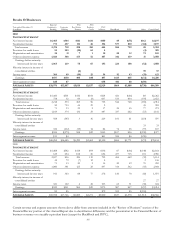
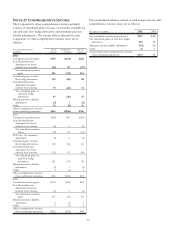
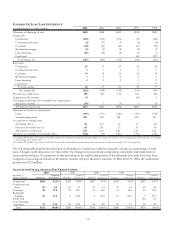
SELECTED QUARTERLY FINANCIAL DATA
2002 2001(a)
Dollars in millions,
except per share data Fourth Third Second First Fourth Third Second First
SUMMARY OF OPERATIONS
Interest income $741 $769 $804 $858 $902 $984 $1,079 $1,172
Interest expense 217 241 249 268 324 419 514 618
Net interest income 524 528 555 590 578 565 565 554
Provision for credit losses 65 73 89 82 668 110 45 80
Noninterest income before net securities
gains (losses) 765 703 854 786 446 646 729 700
Net securities gains(losses) 168 16 4 (3)881729
Noninterest expense 791 790 839 807 1,007 805 807 795
Income (loss) from continuing operations
before minority interest and income taxes 434 436 497 491 (654) 384 459 408
Minority interest in income of
consolidated entities 11 4 12 10 8988
Income taxes 145 147 165 164 (232) 128 156 135
Income (loss) from continuing operations 278 285 320 317 (430) 247 295 265
(Loss) income from discontinued operations (16) 5
Income (loss) before cumulative effect of
accounting change 262 285 320 317 (430) 247 295 270
Cumulative effect of accounting change (5)
Net income (loss) $262 $285 $320 $317 $(430) $247 $295 $265
PER COMMON SHARE DATA
Book value $24.03 $23.62 $22.46 $21.02 $20.54 $23.09 $22.60 $22.39
Basic earnings (loss) (b)
Continuing operations .97 1.00 1.13 1.12 (1.52) .85 1.01 .90
Discontinued operations (.05) .02
Before cumulative effect of accounting
change .92 1.00 1.13 1.12 (1.52) .85 1.01 .92
Cumulative effect of accounting change (.02)
Net income (loss) .92 1.00 1.13 1.12 (1.52) .85 1.01 .90
Diluted earnings (loss) (c) (d)
Continuing operations .97 1.00 1.12 1.11 (1.52) .84 1.00 .89
Discontinued operations (.05) .02
Before cumulative effect of accounting
change .92 1.00 1.12 1.11 (1.52) .84 1.00 .91
Cumulative effect of accounting change (.02)
Net income (loss) .92 1.00 1.12 1.11 (1.52) .84 1.00 .89
(a) See Note 5 Fourth Quarter 2001 Actions for further information regarding items impacting the comparability of fourth quarter 2001 amounts with other quarterly data presented.
(b) The sum of the quarterly amounts for each year do not equal the respective year’s amount because the quarterly calculations are based on a changing number of average shares.
(c) The sum of the quarterly amounts in 2001 does not equal the year’s amount because the quarterly calculations are based on a changing number of average shares.
(d) Additional shares were excluded from fourth quarter 2001 EPS calculations since they were antidilutive.
The Statistical Information (unaudited) presented on pages 108 through 113 reflects the residential mortgage business, which was sold on January 31,
2001, in discontinued operations, unless otherwise noted.