PNC Bank 2002 Annual Report Download - page 35
Download and view the complete annual report
Please find page 35 of the 2002 PNC Bank annual report below. You can navigate through the pages in the report by either clicking on the pages listed below, or by using the keyword search tool below to find specific information within the annual report.-
 1
1 -
2
-
3
-
4
-
5
-
6
-
7
-
8
-
9
-
10
-
11
-
12
-
13
-
14
-
15
-
16
-
17
-
18
-
19
-
20
-
21
-
22
-
23
-
24
-
 25
25 -
 26
26 -
 27
27 -
 28
28 -
 29
29 -
 30
30 -
 31
31 -
 32
32 -
 33
33 -
 34
34 -
 35
35 -
 36
36 -
 37
37 -
 38
38 -
 39
39 -
 40
40 -
 41
41 -
 42
42 -
 43
43 -
 44
44 -
 45
45 -
46
-
47
-
48
-
49
-
50
-
51
-
52
-
53
-
54
-
55
-
56
-
57
-
58
-
59
-
60
-
61
-
62
-
63
-
64
-
65
-
66
-
67
-
68
-
69
-
70
-
71
-
72
-
73
-
74
-
75
-
76
-
77
-
78
-
79
-
80
-
81
-
82
-
83
-
84
-
85
-
86
-
87
-
88
-
89
-
90
-
91
-
92
-
93
-
94
-
95
-
96
-
97
-
98
-
99
-
100
-
101
-
102
-
103
-
104
-
105
-
106
-
107
-
108
-
109
-
110
-
111
-
112
-
113
-
114
-
115
-
116
-
117
 |
 |

33
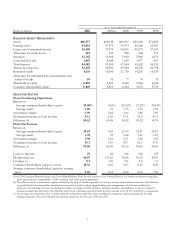
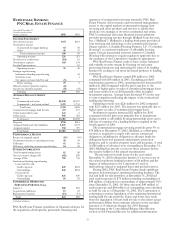
WHOLESALE BANKING
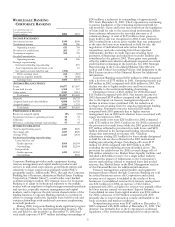
PNC REAL ESTATE FINANCE
Year ended December 31
Taxable-equivalent basis
Dollars in millions 2002 2001
INCOME STATEMENT
Net interest income $117 $118
Noninterest income
Commercial mortgage banking 65 58
Other 44 37
Total noninterest income 109 95
Operating revenue 226 213
Provision for credit losses (10) 16
Noninterest expense 160 139
Goodwill amortization 18
Operating income 76 40
Strategic repositioning:
Institutional lending repositioning 34
Severance costs 1
Net (gains) on loans held for sale (3)
Pretax earnings 79 5
Minority interest (benefit) expense (2)
Income tax (benefit) expense (9) (33)
Earnings $90 $38
AVERAGE BALANCE SHEET
Loans
Commercial real estate $2,230 $2,337
Commercial – real estate related 1,471 1,751
Total loans 3,701 4,088
Commercial mortgages held for sale 271 273
Other loans held for sale 141 6
Other assets 905 923
Total assets $5,018 $5,290
Deposits $750 $518
Assigned funds and other liabilities 3,876 4,375
Assigned capital 392 397
Total funds $5,018 $5,290
PERFORMANCE RATIOS
Return on assigned capital 23% 10%
Noninterest income to operating revenue 48 45
Efficiency 63 60
Efficiency, excluding strategic repositioning 64 58
OTHER INFORMATION
Total nonperforming assets $2 $6
Net (recoveries) charge-offs $(6) $30
Average FTEs 789 743
Institutional lending repositioning
Loans held for sale
Credit exposure $49 $324
Outstandings $44 $244
Exit portfolio
Credit exposure $25 $30
Outstandings $4 $5
COMMERCIAL MORTGAGE
SERVICING PORTFOLIO (a)
January 1 $68 $54
Acquisitions/additions 19 25
Repayments/transfers (13) (11)
Total $74 $68
(a) Dollars in billions.
PNC Real Estate Finance specializes in financial solutions for
the acquisition, development, permanent financing and
operation of commercial real estate nationally. PNC Real
Estate Finance offers treasury and investment management,
access to the capital markets, commercial mortgage loan
servicing and other products and services to clients that
develop, own, manage or invest in commercial real estate.
PNC’s commercial real estate financial services platform
provides processing services through Midland Loan Services,
Inc. (“Midland”). Midland is a leading third-party provider of
loan servicing and technology to the commercial real estate
finance industry. Columbia Housing Partners, L.P. (“Columbia
Housing”) is a national syndicator of affordable housing
equity. Certain incremental activities related to Columbia
Housing will continue to require regulatory approvals due to
the existence of the Corporation’s regulatory agreements.
PNC Real Estate Finance seeks to have a more balanced
and valuable revenue stream by focusing on real estate
processing businesses and increasing the value of its lending
business by seeking to sell more fee-based products to lending
customers.
PNC Real Estate Finance earned $90 million in 2002
compared with $38 million in 2001. Excluding goodwill
amortization expense in 2001, operating income increased $18
million in 2002 compared with the prior year due to the
impact of higher gains on sales of commercial mortgage loans
and lower credit costs in 2002 partially offset by higher
noninterest expense. Average loans decreased 9% in the year-
to-year comparison reflecting the impact of the institutional
lending repositioning.
Operating revenue was $226 million for 2002 compared
with $213 million for 2001. The increase was primarily due to
higher gains on sales of commercial mortgage loans.
Noninterest expense increased $21 million for 2002
compared with the prior year primarily due to impairment
charges related to affordable housing partnership assets and a
full year of expenses for a lending business acquired in the
fourth quarter of 2001.
The commercial mortgage servicing portfolio grew 9% to
$74 billion at December 31, 2002. Midland, as a third-party
servicer, is required to comply with various contractual
obligations, including the obligation to advance funds for
delinquent borrower payments and property protection
purposes, and to monitor property taxes and insurance. A total
of $80 million of advances were outstanding at December 31,
2002. Midland has priority to recover these advances before
the security holders of the related securitizations.
The provision for credit losses for the year ended
December 31, 2002 reflected the benefit of a net recovery in
the exited warehouse lending business of $6 million and the
impact of refinements to the Corporation’s reserve
methodology related to impaired loans and pooled reserves.
During 2002, PNC Real Estate Finance made significant
progress in downsizing its institutional lending business. The
exit and held for sale portfolios at December 31, 2002 had
total credit exposure of $74 million including outstandings of
$48 million, a reduction in outstandings of approximately 81%
since December 31, 2001. Of these amounts, $49 million of
credit exposure and $44 million of outstandings were classified
as held for sale as of December 31, 2002. The Corporation is
continuing to pursue liquidation of the remaining institutional
lending held for sale portfolio. Gains and losses may result
from the liquidation of loans held for sale to the extent actual
performance differs from estimates inherent in the recorded
amounts or if valuations change. See 2001 Strategic
Repositioning in the Consolidated Balance Sheet Review
section of this Financial Review for additional information.