PNC Bank 2002 Annual Report Download - page 59
Download and view the complete annual report
Please find page 59 of the 2002 PNC Bank annual report below. You can navigate through the pages in the report by either clicking on the pages listed below, or by using the keyword search tool below to find specific information within the annual report.-
 1
1 -
2
-
3
-
4
-
5
-
6
-
7
-
8
-
9
-
10
-
11
-
12
-
13
-
14
-
15
-
16
-
17
-
18
-
19
-
20
-
21
-
22
-
23
-
24
-
25
-
26
-
27
-
28
-
29
-
30
-
31
-
32
-
33
-
34
-
35
-
36
-
37
-
38
-
39
-
40
-
41
-
42
-
43
-
44
-
45
-
46
-
47
-
48
-
 49
49 -
 50
50 -
 51
51 -
 52
52 -
 53
53 -
 54
54 -
 55
55 -
 56
56 -
 57
57 -
 58
58 -
 59
59 -
 60
60 -
 61
61 -
 62
62 -
 63
63 -
 64
64 -
 65
65 -
 66
66 -
 67
67 -
 68
68 -
 69
69 -
70
-
71
-
72
-
73
-
74
-
75
-
76
-
77
-
78
-
79
-
80
-
81
-
82
-
83
-
84
-
85
-
86
-
87
-
88
-
89
-
90
-
91
-
92
-
93
-
94
-
95
-
96
-
97
-
98
-
99
-
100
-
101
-
102
-
103
-
104
-
105
-
106
-
107
-
108
-
109
-
110
-
111
-
112
-
113
-
114
-
115
-
116
-
117
 |
 |
57
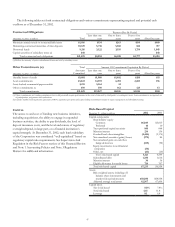
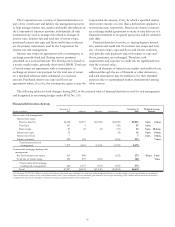
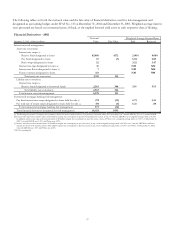
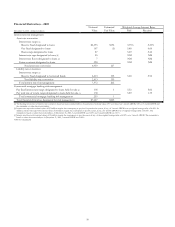
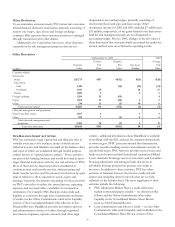
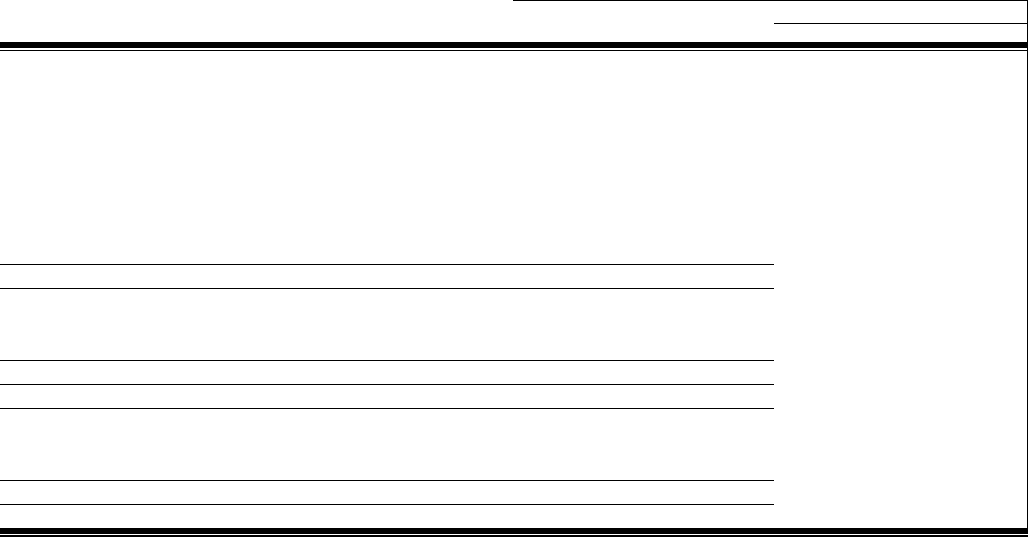
The following tables set forth the notional value and the fair value of financial derivatives used for risk management and
designated as accounting hedges under SFAS No. 133 at December 31, 2002 and December 31, 2001. Weighted-average interest
rates presented are based on contractual terms, if fixed, or the implied forward yield curve at each respective date, if floating.
Financial Derivatives - 2002
Notional Weighted-Average Interest Rates
December 31, 2002 - dollars in millions
V
alue Fair Value Paid Received
Interest rate risk management
Asset rate conversion
Interest rate swaps (a)
Receive fixed designated to loans $3,460 $172 2.00% 4.08%
Pay fixed designated to loans 67 (7) 6.04 2.80
Basis swaps designated to loans 52 3.52 3.47
Interest rate caps designated to loans (b) 16 NM NM
Interest rate floors designated to loans (c) 7NMNM
Future contracts designated to loans 313 NM NM
Total asset rate conversion 3,915 165
Liability rate conversion
Interest rate swaps (a)
Receive fixed designated to borrowed funds 2,363 346 3.16 5.93
Total liability rate conversion 2,363 346
Total interest rate risk management 6,278 511
Commercial mortgage banking risk management
Pay fixed interest rate swaps designated to loans held for sale (a) 273 (13) 4.73 4.36
Pay total rate of return swaps designated to loans held for sale (a) 100 (3) 5.21 .88
Total commercial mortgage banking risk management 373 (16)
Total financial derivatives designated for risk management $6,651 $495
(a) The floating rate portion of interest rate contracts is based on money-market indices. As a percent of notional value, 60% were based on 1-month LIBOR, 40% on 3-month LIBOR.
(b) Interest rate caps with notional values of $12 million require the counterparty to pay the Corporation the excess, if any, of 3-month LIBOR over a weighted-average strike of 6.50%.
In addition, interest rate caps with notional values of $4 million require the counterparty to pay the excess, if any, of Prime over a weighted-average strike of 5.03%. At December 31,
2002, 3-month LIBOR was 1.38% and Prime was 4.25%.
(c) Interest rate floors with notional values of $5 million require the counterparty to pay the excess, if any, of the weighted-average strike of 4.50% over 3-month LIBOR. In addition,
interest rate floors with notional values of $2 million require the counterparty to pay the excess, if any, of the weighted-average strike of 7.25% over Prime. At December 31, 2002,
3-month LIBOR was 1.38% and Prime was 4.25%.
NM- Not meaningful