PNC Bank 2002 Annual Report Download - page 57
Download and view the complete annual report
Please find page 57 of the 2002 PNC Bank annual report below. You can navigate through the pages in the report by either clicking on the pages listed below, or by using the keyword search tool below to find specific information within the annual report.-
 1
1 -
2
-
3
-
4
-
5
-
6
-
7
-
8
-
9
-
10
-
11
-
12
-
13
-
14
-
15
-
16
-
17
-
18
-
19
-
20
-
21
-
22
-
23
-
24
-
25
-
26
-
27
-
28
-
29
-
30
-
31
-
32
-
33
-
34
-
35
-
36
-
37
-
38
-
39
-
40
-
41
-
42
-
43
-
44
-
45
-
46
-
 47
47 -
 48
48 -
 49
49 -
 50
50 -
 51
51 -
 52
52 -
 53
53 -
 54
54 -
 55
55 -
 56
56 -
 57
57 -
 58
58 -
 59
59 -
 60
60 -
 61
61 -
 62
62 -
 63
63 -
 64
64 -
 65
65 -
 66
66 -
 67
67 -
68
-
69
-
70
-
71
-
72
-
73
-
74
-
75
-
76
-
77
-
78
-
79
-
80
-
81
-
82
-
83
-
84
-
85
-
86
-
87
-
88
-
89
-
90
-
91
-
92
-
93
-
94
-
95
-
96
-
97
-
98
-
99
-
100
-
101
-
102
-
103
-
104
-
105
-
106
-
107
-
108
-
109
-
110
-
111
-
112
-
113
-
114
-
115
-
116
-
117
 |
 |
55
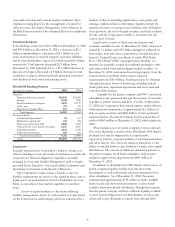
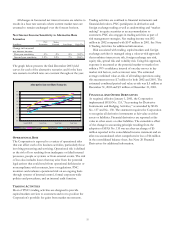
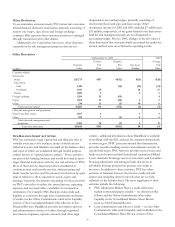
All changes in forecasted net interest income are relative to
results in a base rate scenario where current market rates are
assumed to remain unchanged over the forecast horizon.
Net Interest Income Sensitivity to Alternative Rate
Scenarios
In millions
PNC
Economist
Market
Forward Low/Steep High/Flat
Change in forecasted
net interest income:
First year sensitivity .3% .3% .5% (1.2)%
Second year sensitivity 1.2% 1.0% .7% (2.6)%
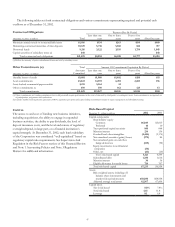
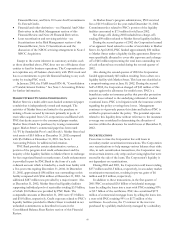
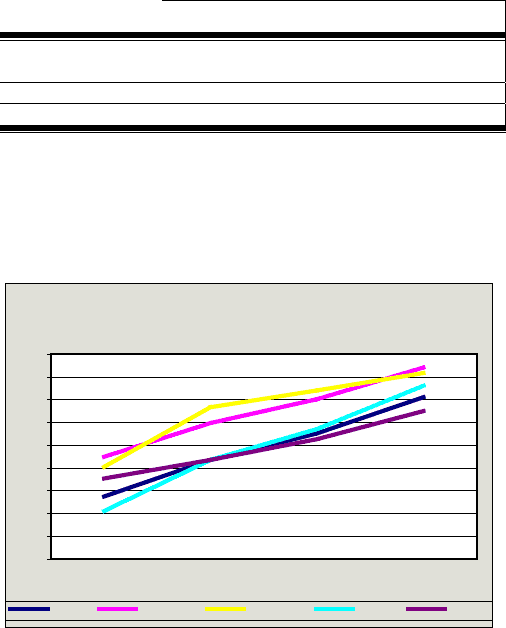
The graph below presents the final December 2003 yield
curves for each of the alternative scenarios and for the base
rate scenario in which rates are constant throughout the year.
OPERATIONAL RISK
The Corporation is exposed to a variety of operational risks
that can affect each of its business activities, particularly those
involving processing and servicing. Operational risk is defined
as the risk of loss resulting from inadequate or failed internal
processes, people or systems or from external events. The risk
of loss also includes losses that may arise from the potential
legal actions that could result from operational deficiencies or
noncompliance with contracts, laws or regulations. PNC
monitors and evaluates operational risk on an ongoing basis
through systems of internal control, formal corporate-wide
policies and procedures, and an internal audit function.
TRADING ACTIVITIES
Most of PNC’s trading activities are designed to provide
capital markets services to customers and not to position the
Corporation’s portfolio for gains from market movements.
Trading activities are confined to financial instruments and
financial derivatives. PNC participates in derivatives and
foreign exchange trading as well as underwriting and “market
making” in equity securities as an accommodation to
customers. PNC also engages in trading activities as part of
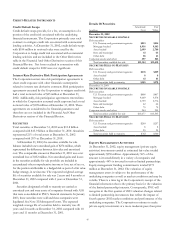
risk management strategies. Net trading income was $92
million in 2002 compared with $147 million in 2001. See Note
8 Trading Activities for additional information.
Risk associated with trading, capital markets and foreign
exchange activities is managed using a value-at-risk approach
that combines interest rate risk, foreign exchange rate risk,
equity risk, spread risk and volatility risk. Using this approach,
exposure is measured as the potential market-to-market loss
within a 99% confidence interval of one-day moves in key
market risk factors, such as interest rates. The estimated
average combined value-at-risk of all trading operations using
this measurement was $.7 million for both 2002 and 2001. The
estimated combined period-end value-at-risk was $.5 million at
December 31, 2002 and $.9 million at December 31, 2001.
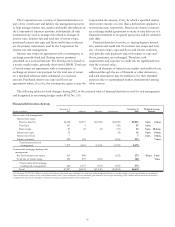
FINANCIAL AND OTHER DERIVATIVES
As required, effective January 1, 2001, the Corporation
implemented SFAS No. 133, “Accounting for Derivative
Instruments and Hedging Activities,” as amended by SFAS
No. 137 and No. 138. The statement requires the Corporation
to recognize all derivative instruments at fair value as either
assets or liabilities. Financial derivatives are reported at fair
value in other assets or other liabilities. The cumulative effect
of the change in accounting principle resulting from the
adoption of SFAS No. 133 was an after-tax charge of $5
million reported in the consolidated income statement and an
after-tax accumulated other comprehensive loss of $4 million
in the consolidated balance sheet. See Note 20 Financial
Derivatives for additional information.
Alternative Interest Rate Scenarios
0.00
0.50
1.00
1.50
2.00
2.50
3.00
3.50
4.00
4.50
1-month LIBOR 2-year Swap 3-year Swap 5-year Swap
Base Rates PNC Economist Market Forward Low / Steep High / Flat