PNC Bank 2002 Annual Report Download - page 90
Download and view the complete annual report
Please find page 90 of the 2002 PNC Bank annual report below. You can navigate through the pages in the report by either clicking on the pages listed below, or by using the keyword search tool below to find specific information within the annual report.-
 1
1 -
2
-
3
-
4
-
5
-
6
-
7
-
8
-
9
-
10
-
11
-
12
-
13
-
14
-
15
-
16
-
17
-
18
-
19
-
20
-
21
-
22
-
23
-
24
-
25
-
26
-
27
-
28
-
29
-
30
-
31
-
32
-
33
-
34
-
35
-
36
-
37
-
38
-
39
-
40
-
41
-
42
-
43
-
44
-
45
-
46
-
47
-
48
-
49
-
50
-
51
-
52
-
53
-
54
-
55
-
56
-
57
-
58
-
59
-
60
-
61
-
62
-
63
-
64
-
65
-
66
-
67
-
68
-
69
-
70
-
71
-
72
-
73
-
74
-
75
-
76
-
77
-
78
-
79
-
 80
80 -
 81
81 -
 82
82 -
 83
83 -
 84
84 -
 85
85 -
 86
86 -
 87
87 -
 88
88 -
 89
89 -
 90
90 -
 91
91 -
 92
92 -
 93
93 -
 94
94 -
 95
95 -
 96
96 -
 97
97 -
 98
98 -
 99
99 -
 100
100 -
101
-
102
-
103
-
104
-
105
-
106
-
107
-
108
-
109
-
110
-
111
-
112
-
113
-
114
-
115
-
116
-
117
 |
 |
88
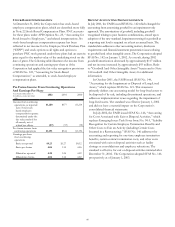
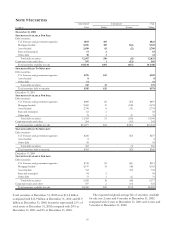
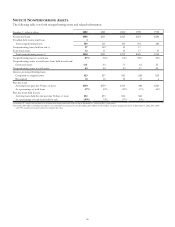
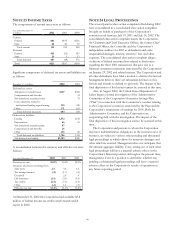
NOTE 11 NONPERFORMING ASSETS
The following table sets forth nonperforming assets and related information:
December 31 - dollars in millions 2002 2001 2000 1999 1998
Nonaccrual loans $308 $211 $323 $291 $286
Troubled debt restructured loan 1
Total nonperforming loans 309 211 323 291 286
Nonperforming loans held for sale (a) 97 169 33 17
Foreclosed assets 12 11 16 17 33
T
otal non
p
erformin
g
assets (b) $418 $391 $372 $325 $319
Nonperforming loans to total loans .87% .56% .64% .59% .50%
Nonperforming assets to total loans, loans held for sale and
foreclosed assets 1.13 .93 .71 .61 .55
Nonperforming assets to total assets .63 .56 .53 .47 .45
Interest on nonperforming loans
Computed on original terms $23 $27 $42 $28 $25
Recognized 10 10 10 11 6
Past due loans
Accruing loans past due 90 days or more $130 $159 $113 $86 $263
As a percentage of total loans .37% .42% .22% .17% .46%
Past due loans held for sale
Accruing loans held for sale past due 90 days or more $32 $33 $16 $24
As a percentage of total loans held for sale 1.99% .79% .97% .69%
(a) Includes $17 million and $6 million of troubled debt restructured loans held for sale at December 31, 2002 and 2001, respectively.
(b) Excludes $40 million (including $12 million of troubled debt restructured assets), $18 million, $18 million and $13 million of equity management assets at December 31, 2002, 2001, 2000
and 1999, respectively, that are carried at estimated fair value.