PNC Bank 2002 Annual Report Download - page 49
Download and view the complete annual report
Please find page 49 of the 2002 PNC Bank annual report below. You can navigate through the pages in the report by either clicking on the pages listed below, or by using the keyword search tool below to find specific information within the annual report.-
 1
1 -
2
-
3
-
4
-
5
-
6
-
7
-
8
-
9
-
10
-
11
-
12
-
13
-
14
-
15
-
16
-
17
-
18
-
19
-
20
-
21
-
22
-
23
-
24
-
25
-
26
-
27
-
28
-
29
-
30
-
31
-
32
-
33
-
34
-
35
-
36
-
37
-
38
-
 39
39 -
 40
40 -
 41
41 -
 42
42 -
 43
43 -
 44
44 -
 45
45 -
 46
46 -
 47
47 -
 48
48 -
 49
49 -
 50
50 -
 51
51 -
 52
52 -
 53
53 -
 54
54 -
 55
55 -
 56
56 -
 57
57 -
 58
58 -
 59
59 -
60
-
61
-
62
-
63
-
64
-
65
-
66
-
67
-
68
-
69
-
70
-
71
-
72
-
73
-
74
-
75
-
76
-
77
-
78
-
79
-
80
-
81
-
82
-
83
-
84
-
85
-
86
-
87
-
88
-
89
-
90
-
91
-
92
-
93
-
94
-
95
-
96
-
97
-
98
-
99
-
100
-
101
-
102
-
103
-
104
-
105
-
106
-
107
-
108
-
109
-
110
-
111
-
112
-
113
-
114
-
115
-
116
-
117
 |
 |
47
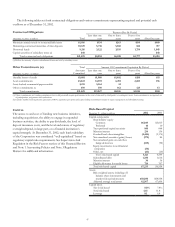
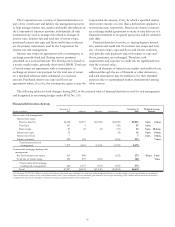
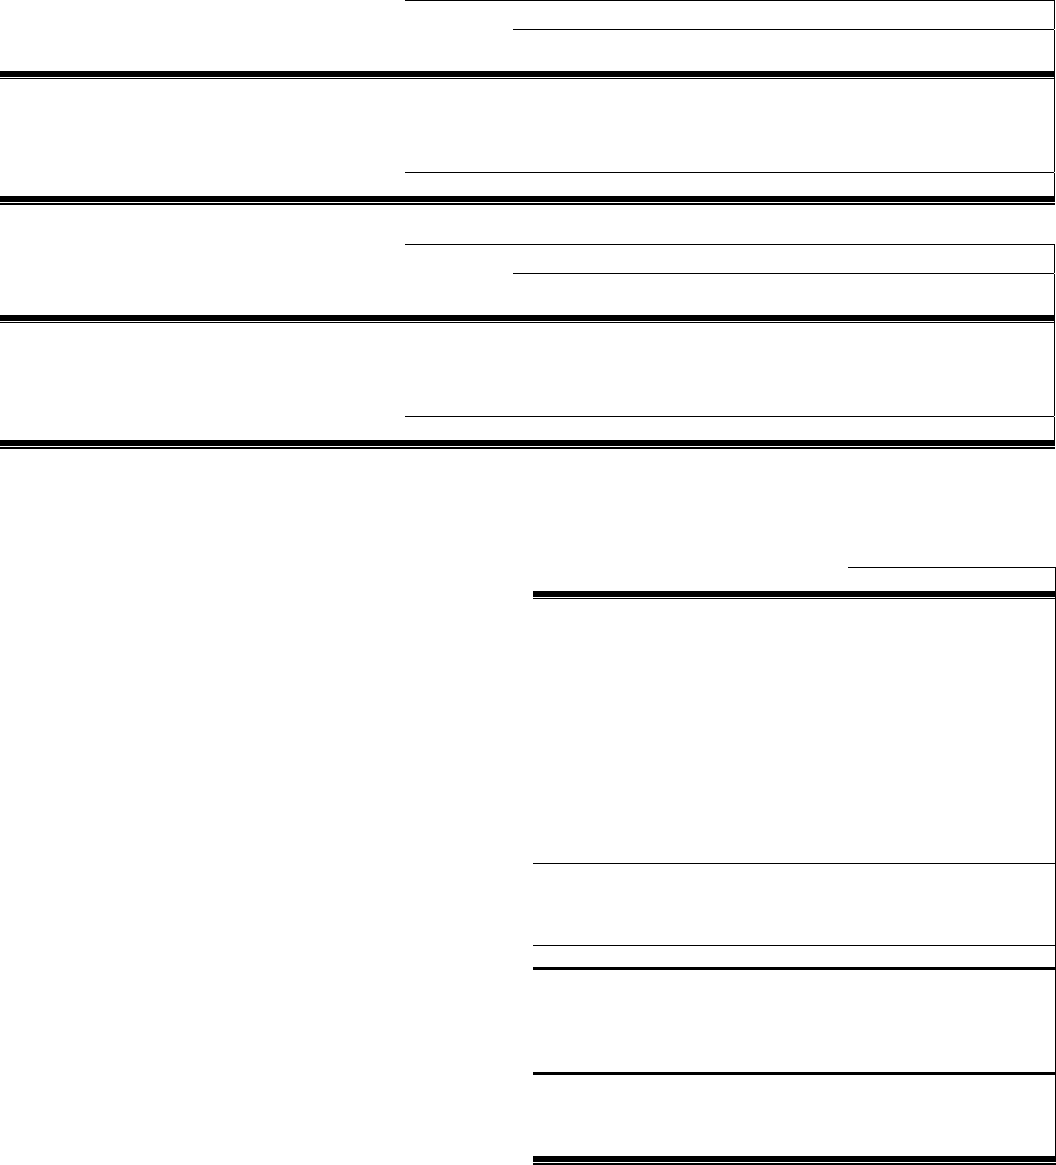
The following tables set forth contractual obligations and various commitments representing required and potential cash
outflows as of December 31, 2002.
Contractual Obligations Payment Due By Period
December 31, 2002 - in millions Total
Less than one
year
One to three
years
Four to five
years After five years
Minimum annual rentals on noncancellable leases $1,016 $154 $263 $199 $400
Remaining contractual maturities of time deposits 10,619 5,718 3,360 824 717
Borrowed funds 9,116 3,122 3,195 1,754 1,045
Capital securities of subsidiary trusts (a) 848 848
Total contractual cash obligations $21,599 $8,994 $6,818 $2,777 $3,010
(a) Reflects the maturity of junior subordinated debentures held by subsidiary trusts.
Other Commitments (a) Total Amount Of Commitment Expiration By Period
December 31, 2002 - in millions
Amounts
Committed
Less than one
year
One to three
years
Four to five
years After five years
Standby letters of credit $3,681 $1,980 $1,402 $288 $11
Loan commitments 23,643 14,393 6,491 2,603 156
Asset-backed commercial paper conduit 3,215 3,164 51
Other commitments (b) 690 390 162 125 13
Total commitments $31,229 $19,927 $8,106 $3,016 $180
(a) Other commitments are funding commitments that could potentially require performance in the event of demands by third parties or contingent events. Loan commitments are reported net
of participations, assignments and syndications.
(b) Includes standby bond repurchase agreements, NBOC acquisition put option and equity funding commitments related to equity management and affordable housing.
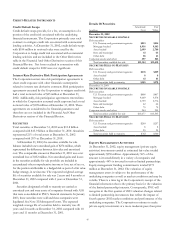
CAPITAL
The access to and cost of funding new business initiatives,
including acquisitions, the ability to engage in expanded
business activities, the ability to pay dividends, the level of
deposit insurance costs, and the level and nature of regulatory
oversight depend, in large part, on a financial institution’s
capital strength. At December 31, 2002, each bank subsidiary
of the Corporation was considered “well-capitalized” based on
regulatory capital ratio requirements. See Supervision And
Regulation in the Risk Factors section of this Financial Review
and Note 1 Accounting Policies and Note 3 Regulatory
Matters for additional information.
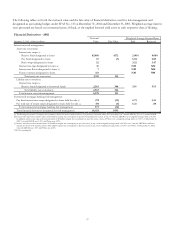
Risk-Based Capital
December 31 - dollars in millions 2002 2001
Capital components
Shareholders’ equity
Common $6,849 $5,813
Preferred 10 10
Trust preferred capital securities 848 848
Minority interest 234 134
Goodwill and other intangibles (2,446) (2,174)
Net unrealized securities (gains)/losses (179) 86
Net unrealized gains on cash flow
hedge derivatives (135) (98)
Equity investments in nonfinancial
companies (34)
Other, net (26) (20)
Tier I risk-based capital 5,121 4,599
Subordinated debt 1,350 1,616
Minority interest 36 36
Eligible allowance for credit losses 726 707
Total risk-based capital $7,233 $6,958
Assets
Risk-weighted assets, including off-
balance-sheet instruments and
market risk equivalent assets $58,030 $58,958
Adjusted average total assets 62,967 67,604
Capital ratios
Tier I risk-based 8.8% 7.8%
Total risk-based 12.5 11.8
Leverage 8.1 6.8