PNC Bank 2002 Annual Report Download - page 112
Download and view the complete annual report
Please find page 112 of the 2002 PNC Bank annual report below. You can navigate through the pages in the report by either clicking on the pages listed below, or by using the keyword search tool below to find specific information within the annual report.-
 1
1 -
2
-
3
-
4
-
5
-
6
-
7
-
8
-
9
-
10
-
11
-
12
-
13
-
14
-
15
-
16
-
17
-
18
-
19
-
20
-
21
-
22
-
23
-
24
-
25
-
26
-
27
-
28
-
29
-
30
-
31
-
32
-
33
-
34
-
35
-
36
-
37
-
38
-
39
-
40
-
41
-
42
-
43
-
44
-
45
-
46
-
47
-
48
-
49
-
50
-
51
-
52
-
53
-
54
-
55
-
56
-
57
-
58
-
59
-
60
-
61
-
62
-
63
-
64
-
65
-
66
-
67
-
68
-
69
-
70
-
71
-
72
-
73
-
74
-
75
-
76
-
77
-
78
-
79
-
80
-
81
-
82
-
83
-
84
-
85
-
86
-
87
-
88
-
89
-
90
-
91
-
92
-
93
-
94
-
95
-
96
-
97
-
98
-
99
-
100
-
101
-
 102
102 -
 103
103 -
 104
104 -
 105
105 -
 106
106 -
 107
107 -
 108
108 -
 109
109 -
 110
110 -
 111
111 -
 112
112 -
 113
113 -
 114
114 -
 115
115 -
 116
116 -
 117
117
 |
 |

110
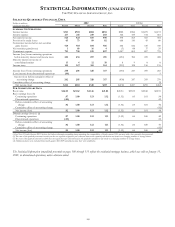
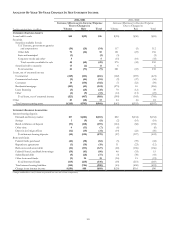
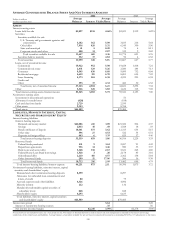
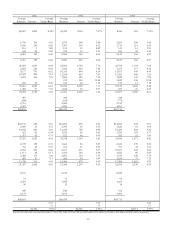
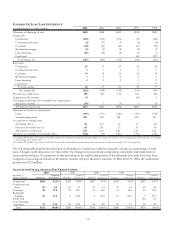
AVERAGE CONSOLIDATED BALANCE SHEET AND NET INTEREST ANALYSIS
2002 2001
Dollars in millions
Taxable-equivalent basis
Average
Balances Interest
Average
Yields/Rates
Average
Balances Interest
Average
Yields/Rates
A
SSETS
Interest-earnin
g
assets
Loans held for sale $2,897 $135 4.66% $2,021 $119 5.89%
Securities
Securities available for sale
U.S. Treasury and government agencies and
corporations 3,182 162 5.09 3,833 216 5.64
Other debt 7,916 420 5.31 6,549 390 5.96
State and municipal 61 5 8.20 74 6 8.11
Corporate stocks and other 488 14 2.87 319 9 2.82
Total securities available for sale 11,647 601 5.16 10,775 621 5.76
Securities held to maturity 352 17 4.83 92 6 6.52
Total securities 11,999 618 5.15 10,867 627 5.77
Loans, net of unearned income
Commercial 15,922 952 5.98 19,658 1,418 7.21
Commercial real estate 2,451 129 5.26 2,580 184 7.13
Consumer 9,545 630 6.60 9,099 732 8.04
Residential mortgage 4,639 311 6.70 8,801 635 7.22
Lease financing 4,173 265 6.35 4,223 293 6.94
Credit card
Other 393 17 4.33 460 30 6.52
Total loans, net of unearned income 37,123 2,304 6.21 44,821 3,292 7.34
Other 3,326 128 3.85 1,632 115 7.05
Total interest-earning assets/interest income 55,345 3,185 5.75 59,341 4,153 7.00
Noninterest-earning assets
Investment in discontinued operations 51
Allowance for credit losses
(
628
)
(
614
)
Cash and due from banks 2,729 2,939
Other assets 9,143 8,768
Total assets $66,589 $70,485
LIABILITIES, MINORITY INTEREST, CAPITAL
SECURITIES AND SHAREHOLDERS’ EQUITY
Interest-bearing liabilities
Interest-bearing deposits
Demand and money market $22,086 241 1.09 $21,322 506 2.37
Savings 2,033 10 .49 1,928 18 .93
Retail certificates of deposit 10,361 375 3.62 12,313 634 5.15
Other time 596 27 4.53 522 34 6.51
Deposits in foreign offices 443 6 1.35 829 37 4.46
Total interest-bearing deposits 35,519 659 1.86 36,914 1,229 3.33
Borrowed funds
Federal funds purchased 551 9 1.63 2,057 91 4.42
Repurchase agreements 956 14 1.46 980 33 3.37
Bank notes and senior debt 5,168 138 2.67 5,521 265 4.80
Federal Home Loan Bank borrowings 1,528 3 .20 2,178 83 3.81
Subordinated debt 2,210 101 4.57 2,362 138 5.84
Other borrowed funds 299 51 17.06 384 36 9.38
Total borrowed funds 10,712 316 2.95 13,482 646 4.79
Total interest-bearing liabilities/interest expense 46,231 975 2.11 50,396 1,875 3.72
Noninterest-bearing liabilities, minority interest, capital
securities and shareholders’ equity
Demand and other noninterest-bearing deposits 8,599 8,297
Allowance for unfunded loan commitments and
letters of credit 80 79
Accrued expenses and other liabilities 4,326 4,096
Minority interest 212 136
Mandatorily redeemable capital securities of
subsidiary trusts 848 848
Shareholders’ equity 6,293 6,633
Total liabilities, minority interest, capital securities
and shareholders’ equity $66,589 $70,485
Interest rate spread 3.64 3.28
Impact of noninterest-bearing sources .35 .56
Net interest income/margin $2,210 3.99% $2,278 3.84%
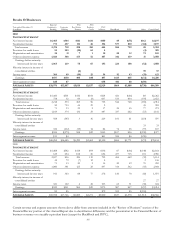
Nonaccrual loans are included in loans, net of unearned income. The impact of financial derivatives used in interest rate risk management is included in the interest and average
yields/rates of the related assets and liabilities. Average balances of securities available for sale are based on amortized historical cost (excluding SFAS No. 115 adjustments to fair value).