PNC Bank 2002 Annual Report Download - page 46
Download and view the complete annual report
Please find page 46 of the 2002 PNC Bank annual report below. You can navigate through the pages in the report by either clicking on the pages listed below, or by using the keyword search tool below to find specific information within the annual report.-
 1
1 -
2
-
3
-
4
-
5
-
6
-
7
-
8
-
9
-
10
-
11
-
12
-
13
-
14
-
15
-
16
-
17
-
18
-
19
-
20
-
21
-
22
-
23
-
24
-
25
-
26
-
27
-
28
-
29
-
30
-
31
-
32
-
33
-
34
-
35
-
 36
36 -
 37
37 -
 38
38 -
 39
39 -
 40
40 -
 41
41 -
 42
42 -
 43
43 -
 44
44 -
 45
45 -
 46
46 -
 47
47 -
 48
48 -
 49
49 -
 50
50 -
 51
51 -
 52
52 -
 53
53 -
 54
54 -
 55
55 -
 56
56 -
57
-
58
-
59
-
60
-
61
-
62
-
63
-
64
-
65
-
66
-
67
-
68
-
69
-
70
-
71
-
72
-
73
-
74
-
75
-
76
-
77
-
78
-
79
-
80
-
81
-
82
-
83
-
84
-
85
-
86
-
87
-
88
-
89
-
90
-
91
-
92
-
93
-
94
-
95
-
96
-
97
-
98
-
99
-
100
-
101
-
102
-
103
-
104
-
105
-
106
-
107
-
108
-
109
-
110
-
111
-
112
-
113
-
114
-
115
-
116
-
117
 |
 |

44
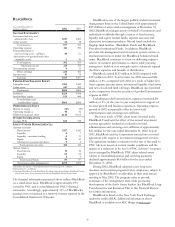
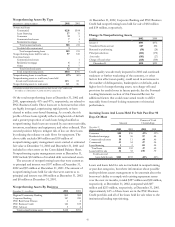
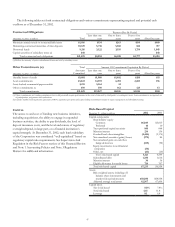
Allocation Of Allowance For Credit Losses
2002 2001
December 31
Dollars in millions Allowance
Loans to
Total Loans Allowance
Loans to
Total Loans
Commercial $504 42.3% $392 40.0%
Commercial
real estate 52 6.4 63 6.3
Consumer 28 27.8 39 24.1
Residential
mortgage 10 11.0 8 16.8
Lease financing
and other 79 12.5 58 12.8
Total $673 100.0% $560 100.0%
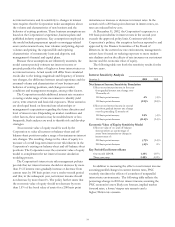
For purposes of this presentation, the unallocated portion of
the allowance for credit losses of $112 million at December
31, 2002 and $143 million at December 31, 2001 has been
assigned to loan categories based on the relative specific and
pool allocation amounts. The unallocated portion of the
allowance for credit losses represents 17% of the total
allowance and .32% of total loans at December 31, 2002,
compared with 26% and .38%, respectively, at December 31,
2001. Enhancements and refinements to the reserve
methodology during 2002 resulted in a reallocation of the
allowance for credit losses among the Corporation’s
businesses and from unallocated to specific and pool
categories.
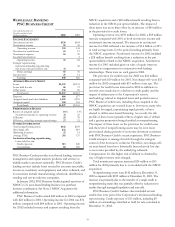
The provision for credit losses for 2002 and the evaluation
of the allowances for credit losses and unfunded loan
commitments and letters of credit as of December 31, 2002
reflected changes in loan portfolio composition, the net
impact of downsizing credit exposure, the impact of
refinements to the Corporation’s reserve methodology and
changes in asset quality. The provision includes amounts for
probable losses on loans and credit exposure related to
unfunded loan commitments and letters of credit.
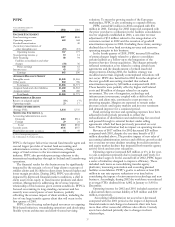
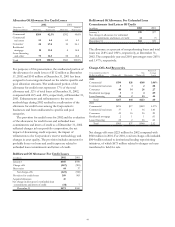
Rollforward Of Allowance For Credit Losses
In millions 2002 2001
January 1 $560 $598
Charge-offs (267) (985)
Recoveries 44 37
Net charge-offs (223) (948)
Provision for credit losses 309 903
Acquired allowance 41
N
et change in allowance for unfunded loa
n
commitments and letters of credit (14) 7
December 31 $673 $560
Rollforward Of Allowance For Unfunded Loan
Commitments And Letters Of Credit
In millions 2002 2001
January 1 $70 $77
Net change in allowance for unfunded
loan commitments and letters of credit 14 (7)
December 31 $84 $70
The allowance as a percent of nonperforming loans and total
loans was 218% and 1.90%, respectively, at December 31,
2002. The comparable year end 2001 percentages were 265%
and 1.47%, respectively.
Charge-Offs And Recoveries
Percent of
Year ended December 31 Net Average
Dollars in millions Charge-offs Recoveries Charge-offs Loans
2002
Commercial $194 $26 $168 1.06%
Commercial real estate 312.08
Consumer 40 14 26 .27
Residential mortgage 514.09
Lease financing 25 2 23 .55
Total $267 $44 $223 .60
2001
Commercial $876 $17 $859 4.37%
Commercial real estate 37 1 36 1.40
Consumer 42 16 26 .29
Residential mortgage 2 1 1 .01
Lease financing 28 2 26 .62
Total $985 $37 $948 2.12
Net charge-offs were $223 million for 2002 compared with
$948 million in 2001. For 2001, total net charge-offs included
$804 million related to institutional lending repositioning
initiatives, of which $673 million related to charges on loans
transferred to held for sale.