PNC Bank 2002 Annual Report Download - page 26
Download and view the complete annual report
Please find page 26 of the 2002 PNC Bank annual report below. You can navigate through the pages in the report by either clicking on the pages listed below, or by using the keyword search tool below to find specific information within the annual report.-
 1
1 -
2
-
3
-
4
-
5
-
6
-
7
-
8
-
9
-
10
-
11
-
12
-
13
-
14
-
15
-
 16
16 -
 17
17 -
 18
18 -
 19
19 -
 20
20 -
 21
21 -
 22
22 -
 23
23 -
 24
24 -
 25
25 -
 26
26 -
 27
27 -
 28
28 -
 29
29 -
 30
30 -
 31
31 -
 32
32 -
 33
33 -
 34
34 -
 35
35 -
 36
36 -
37
-
38
-
39
-
40
-
41
-
42
-
43
-
44
-
45
-
46
-
47
-
48
-
49
-
50
-
51
-
52
-
53
-
54
-
55
-
56
-
57
-
58
-
59
-
60
-
61
-
62
-
63
-
64
-
65
-
66
-
67
-
68
-
69
-
70
-
71
-
72
-
73
-
74
-
75
-
76
-
77
-
78
-
79
-
80
-
81
-
82
-
83
-
84
-
85
-
86
-
87
-
88
-
89
-
90
-
91
-
92
-
93
-
94
-
95
-
96
-
97
-
98
-
99
-
100
-
101
-
102
-
103
-
104
-
105
-
106
-
107
-
108
-
109
-
110
-
111
-
112
-
113
-
114
-
115
-
116
-
117
 |
 |

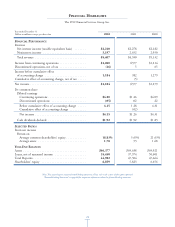
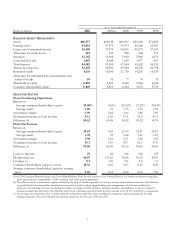
The PNC Financial Services Group, Inc.
Year ended December 31 . . . . . . . . . . . . . . . . . . . . . . . . . . . . . .
Dollars in millions, except per share data . . . . . . . . . . . . . . . . . . . 2002 2001 2000
FINANCIAL PERFORMANCE . . . . . . . . . . . . . . . .
Revenue . . . . . . . . . . . . . . . . . . . . . . . . . . . . .
Net interest income (taxable equivalent basis) . . . . . . . $2,210 $2,278 $2,182
Noninterest income . . . . . . . . . . . . . . . . . . . . . . . . . . 3,197 2,652 2,950
Total revenue . . . . . . . . . . . . . . . . . . . . . . . . . . . . . . . $5,407 $4,930 $5,132
Income from continuing operations . . . . . . . . . . . . . . . . $1,200 $377 $1,214
Discontinued operations, net of tax . . . . . . . . . . . . . . . . (16) 565
Income before cumulative effect
of accounting change . . . . . . . . . . . . . . . . . . . . . . . . . 1,184 382 1,279
Cumulative effect of accounting change, net of tax . . . . . (5)
Net income . . . . . . . . . . . . . . . . . . . . . . . . . . . . . . . . . . $1,184 $377 $1,279
Per common share . . . . . . . . . . . . . . . . . . . . . . . . . . . . .
Diluted earnings . . . . . . . . . . . . . . . . . . . . . . . . . . . . .
Continuing operations . . . . . . . . . . . . . . . . . . . . . . . $4.20 $1.26 $4.09
Discontinued operations . . . . . . . . . . . . . . . . . . . . . (.05) .02 .22
Before cumulative effect of accounting change . . . . . 4.15 1.28 4.31
Cumulative effect of accounting change . . . . . . . . . . (.02)
Net income . . . . . . . . . . . . . . . . . . . . . . . . . . . . . . . $4.15 $1.26 $4.31
Cash dividends declared . . . . . . . . . . . . . . . . . . . . . . . $1.92 $1.92 $1.83
SELECTED RATIOS . . . . . . . . . . . . . . . . . . . . . . . . . . . .
From net income . . . . . . . . . . . . . . . . . . . . . . . . . . . . . .
Return on . . . . . . . . . . . . . . . . . . . . . . . . . . . . . . . . .
Average common shareholders’ equity . . . . . . . . . . . . 18.83% 5.65% 21.63%
Average assets . . . . . . . . . . . . . . . . . . . . . . . . . . . . . 1.78 .53 1.68
YEAR-END BALANCES . . . . . . . . . . . . . . . . . . . . . . . . . .
Assets . . . . . . . . . . . . . . . . . . . . . . . . . . . . . . . . . . . . . . $66,377 $69,638 $69,921
Loans, net of unearned income . . . . . . . . . . . . . . . . . . . 35,450 37,974 50,601
Total Deposits . . . . . . . . . . . . . . . . . . . . . . . . . . . . . . . . 44,982 47,304 47,664
Shareholders’ equity . . . . . . . . . . . . . . . . . . . . . . . . . . . 6,859 5,823 6,656
Note: This annual report contains forward-looking statements. Please refer to the section of this report captioned
“Forward-Looking Statements” on page 66 for important information related to forward-looking statements.
FINANCIAL HIGHLIGHTS
24