PNC Bank 2002 Annual Report Download - page 33
Download and view the complete annual report
Please find page 33 of the 2002 PNC Bank annual report below. You can navigate through the pages in the report by either clicking on the pages listed below, or by using the keyword search tool below to find specific information within the annual report.-
 1
1 -
2
-
3
-
4
-
5
-
6
-
7
-
8
-
9
-
10
-
11
-
12
-
13
-
14
-
15
-
16
-
17
-
18
-
19
-
20
-
21
-
22
-
 23
23 -
 24
24 -
 25
25 -
 26
26 -
 27
27 -
 28
28 -
 29
29 -
 30
30 -
 31
31 -
 32
32 -
 33
33 -
 34
34 -
 35
35 -
 36
36 -
 37
37 -
 38
38 -
 39
39 -
 40
40 -
 41
41 -
 42
42 -
 43
43 -
44
-
45
-
46
-
47
-
48
-
49
-
50
-
51
-
52
-
53
-
54
-
55
-
56
-
57
-
58
-
59
-
60
-
61
-
62
-
63
-
64
-
65
-
66
-
67
-
68
-
69
-
70
-
71
-
72
-
73
-
74
-
75
-
76
-
77
-
78
-
79
-
80
-
81
-
82
-
83
-
84
-
85
-
86
-
87
-
88
-
89
-
90
-
91
-
92
-
93
-
94
-
95
-
96
-
97
-
98
-
99
-
100
-
101
-
102
-
103
-
104
-
105
-
106
-
107
-
108
-
109
-
110
-
111
-
112
-
113
-
114
-
115
-
116
-
117
 |
 |

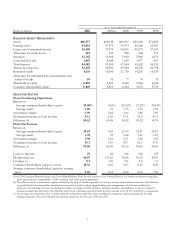
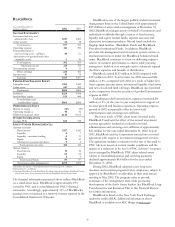
31
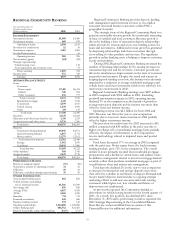
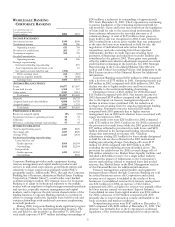
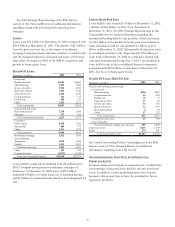
REGIONAL COMMUNITY BANKING
Year ended December 31
Taxable-equivalent basis
Dollars in millions 2002 2001
INCOME STATEMENT
Net interest income $1,409 $1,466
Noninterest income 689 679
Operating revenue 2,098 2,145
Provision for credit losses 52 50
Noninterest expense 1,061 1,063
Goodwill amortization 36
Operating income 985 996
Net securities (gains) (84) (86)
Strategic repositioning:
Vehicle leasing costs 135
Asset impairment and severance costs 13
Pretax earnings 1,069 934
Income taxes 372 338
Earnings $697 $596
AVERAGE BALANCE SHEET
Loans
Consumer
Home equity $7,101 $6,351
Indirect 541 814
Other consumer 632 777
Total consumer 8,274 7,942
Residential mortgage 4,110 7,912
Commercial 3,599 3,557
Vehicle leasing 1,678 1,901
Other 119 133
Total loans 17,780 21,445
Securities 11,139 10,241
Education and other loans held for sale 1,319 1,293
Assigned assets and other assets 8,738 7,306
Total assets $38,976 $40,285
Deposits
Noninterest-bearing demand $5,046 $4,571
Interest-bearing demand 6,057 5,713
Money market 12,279 12,162
Total transaction deposits 23,382 22,446
Savings 1,962 1,870
Certificates 10,045 11,906
Total deposits 35,389 36,222
Other liabilities 958 1,345
Assigned capital 2,629 2,718
Total funds $38,976 $40,285
PERFORMANCE RATIOS
Return on assigned capital 27% 22%
Noninterest income to operating revenue 33 32
Efficiency 49 54
Efficiency, excluding strategic repositioning 51 50
OTHER INFORMATION
Total nonperforming assets $82 $52
Vehicle leasing outstandings,
net of unearned income $1,386 $1,930
Net charge-offs $56 $50
Average FTEs 9,657 9,953
ATMs 3,550 3,250
Branches 714 712
Financial consultants 645 568
Business banking centers 193 140
Checking relationships 1,542,000 1,440,000
Online banking users 606,752 421,325
Deposit households using online banking 36.6% 27.2%
Regional Community Banking provides deposit, lending,
cash management and investment services to two million
consumer and small business customers within PNC’s
geographic footprint.
The strategic focus of the Regional Community Bank is to
generate sustainable revenue growth by consistently increasing
its base of satisfied and loyal customers. Revenue growth is
driven by building a base of transaction deposit relationships
which provide fee revenue and a low-cost funding source for
loans and investments. Additional revenue growth is generated
by deepening relationships with these customers through
cross-selling of other products and services. The significant
growth in online banking users is helping to improve customer
loyalty and retention.
During 2002, Regional Community Banking increased the
number of checking relationships by 8% causing increases in
transaction deposits and fee revenues. Customer growth was
driven by simultaneous improvements in the rates of customer
acquisition and retention. Despite this trend and success in
keeping deposit funding costs low, this business was adversely
impacted by a reduction in average residential mortgages and
vehicle leases and lower investment yields in the relatively low
interest rate environment in 2002.
Regional Community Banking earnings were $697 million
in 2002 compared with $596 million in 2001. Excluding
goodwill amortization expense in 2001, operating income
declined 5% in the comparison as the benefit of growth in
average transaction deposits and fee income was more than
offset by lower net interest income.
Operating revenue was $2.1 billion for both 2002 and
2001. Revenue was flat in the year-to-year comparison
primarily due to lower net interest income in 2002 partially
offset by higher noninterest income.
The provision for credit losses for 2002 increased to $52
million compared with $50 million in the prior year due to
higher net charge-offs on residential mortgage loans partially
offset by the impact of refinements to the Corporations’
reserve methodology related to impaired loans and pooled
reserves.
Total loans decreased 17% on average in 2002 compared
with the prior year. Home equity loans, the lead consumer
lending product, grew 12% in the comparison. The overall
decline in loans primarily resulted from residential mortgage
prepayments and a decline in vehicle leases and indirect loans.
In addition, management elected to invest in mortgage-backed
securities rather than purchase residential mortgages as part of
overall balance sheet and interest rate management.
Total deposits declined 2% in the year-to-year comparison
as increases in transaction and savings deposits were more
than offset by a decline in certificates of deposit. Demand and
money market deposits increased due to ongoing strategic
marketing efforts to add new accounts and retain existing
customers while higher cost, less valuable certificates of
deposit were not emphasized.
As previously reported, the Corporation decided to
discontinue its vehicle leasing business in the fourth quarter of
2001. As a result, this portfolio has declined 28% since
December 31, 2001 and is performing overall as expected. See
2001 Strategic Repositioning in the Consolidated Balance
Sheet Review section and Risk Factors section of this
Financial Review for additional information.