PNC Bank 2002 Annual Report Download - page 73
Download and view the complete annual report
Please find page 73 of the 2002 PNC Bank annual report below. You can navigate through the pages in the report by either clicking on the pages listed below, or by using the keyword search tool below to find specific information within the annual report.-
 1
1 -
2
-
3
-
4
-
5
-
6
-
7
-
8
-
9
-
10
-
11
-
12
-
13
-
14
-
15
-
16
-
17
-
18
-
19
-
20
-
21
-
22
-
23
-
24
-
25
-
26
-
27
-
28
-
29
-
30
-
31
-
32
-
33
-
34
-
35
-
36
-
37
-
38
-
39
-
40
-
41
-
42
-
43
-
44
-
45
-
46
-
47
-
48
-
49
-
50
-
51
-
52
-
53
-
54
-
55
-
56
-
57
-
58
-
59
-
60
-
61
-
62
-
 63
63 -
 64
64 -
 65
65 -
 66
66 -
 67
67 -
 68
68 -
 69
69 -
 70
70 -
 71
71 -
 72
72 -
 73
73 -
 74
74 -
 75
75 -
 76
76 -
 77
77 -
 78
78 -
 79
79 -
 80
80 -
 81
81 -
 82
82 -
 83
83 -
84
-
85
-
86
-
87
-
88
-
89
-
90
-
91
-
92
-
93
-
94
-
95
-
96
-
97
-
98
-
99
-
100
-
101
-
102
-
103
-
104
-
105
-
106
-
107
-
108
-
109
-
110
-
111
-
112
-
113
-
114
-
115
-
116
-
117
 |
 |

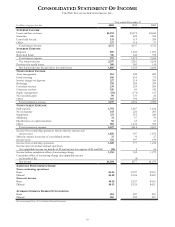
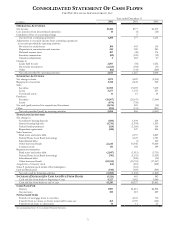
CONSOLIDATED STATEMENT OF CASH FLOWS
THE PNC FINANCIAL SERVICES GROUP, INC.
71
Year ended December 31
In millions 2002 2001 2000
OPERATING ACTIVITIES
Net income $1,184 $377 $1,279
Loss (income) from discontinued operations 16 (5) (65)
Cumulative effect of accounting change 5
Income from continuing operations 1,200 377 1,214
Adjustments to reconcile income from continuing operations
to net cash provided by operating activities
Provision for credit losses 309 903 136
Depreciation, amortization and accretion 242 309 283
Deferred income taxes 487 (48) 376
Securities transactions (89) (128) (29)
Valuation adjustments 2265 27
Change in
Loans held for sale 2,907 (92) 1,652
Short-term investments (2,323) (184) (51)
Other (82) (135) (560)
Net cash provided by operating activities 2,653 1,267 3,048
INVESTING ACTIVITIES
Net change in loans 1,073 4,099 (2,215)
Repayment of securities 3,158 2,445 920
Sales
Securities 16,395 19,693 7,630
Loans 3,277 1,155 551
Foreclosed assets 11 15 24
Purchases
Securities (18,967) (26,147) (7,640)
Loans (874) (758)
Net cash (paid) received for acquisitions/divestitures (1,676) 485 (30)
Other (193) (131) (301)
Net cash provided (used) by investing activities 2,204 856 (1,061)
FINANCING ACTIVITIES
Net change in
Noninterest-bearing deposits (586) 1,634 329
Interest-bearing deposits (1,736) (1,994) 1,533
Federal funds purchased (129) (1,260) 164
Repurchase agreements (140) 347 205
Sales/issuances
Bank notes and senior debt 2,157 2,849
Federal Home Loan Bank borrowings 3,123 1,781
Subordinated debt (1) 100
Other borrowed funds 22,246 35,346 37,060
Common stock 131 184 189
Repayments/maturities
Bank notes and senior debt (2,047) (1,915) (3,715)
Federal Home Loan Bank borrowings (791) (1,576) (3,539)
Subordinated debt (200) (20)
Other borrowed funds (22,323) (35,752) (37,367)
Acquisition of treasury stock (62) (681) (428)
Series F preferred stock tender offer/redemption (301)
Cash dividends paid (546) (569) (546)
Net cash used by financing activities (5,983) (1,458) (1,405)
INCREASE (DECREASE)IN CASH AND DUE FROM BANKS (1,126) 665 582
Cash and due from banks at beginning of year 4,327 3,662 3,080
Cash and due from banks at end of year $3,201 $4,327 $3,662
CASH PAID FOR
Interest $997 $1,813 $2,598
Income taxes 189 215 289
NON-CASH ITEMS
Transfer of mortgage loans to securities 4,341 710
Transfer from (to) loans to (from) loans held for sale, net 263 2,707 (143)
Transfer from loans to other assets 14 11 23
See accompanying Notes To Consolidated Financial Statements.