PNC Bank 2002 Annual Report Download - page 103
Download and view the complete annual report
Please find page 103 of the 2002 PNC Bank annual report below. You can navigate through the pages in the report by either clicking on the pages listed below, or by using the keyword search tool below to find specific information within the annual report.-
 1
1 -
2
-
3
-
4
-
5
-
6
-
7
-
8
-
9
-
10
-
11
-
12
-
13
-
14
-
15
-
16
-
17
-
18
-
19
-
20
-
21
-
22
-
23
-
24
-
25
-
26
-
27
-
28
-
29
-
30
-
31
-
32
-
33
-
34
-
35
-
36
-
37
-
38
-
39
-
40
-
41
-
42
-
43
-
44
-
45
-
46
-
47
-
48
-
49
-
50
-
51
-
52
-
53
-
54
-
55
-
56
-
57
-
58
-
59
-
60
-
61
-
62
-
63
-
64
-
65
-
66
-
67
-
68
-
69
-
70
-
71
-
72
-
73
-
74
-
75
-
76
-
77
-
78
-
79
-
80
-
81
-
82
-
83
-
84
-
85
-
86
-
87
-
88
-
89
-
90
-
91
-
92
-
 93
93 -
 94
94 -
 95
95 -
 96
96 -
 97
97 -
 98
98 -
 99
99 -
 100
100 -
 101
101 -
 102
102 -
 103
103 -
 104
104 -
 105
105 -
 106
106 -
 107
107 -
 108
108 -
 109
109 -
 110
110 -
 111
111 -
 112
112 -
 113
113 -
114
-
115
-
116
-
117
 |
 |

101
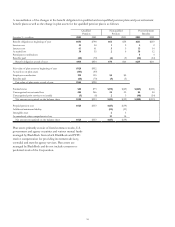
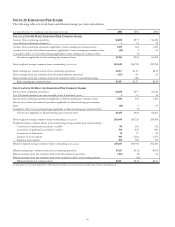
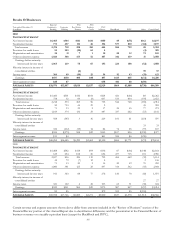
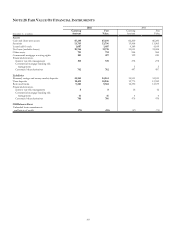
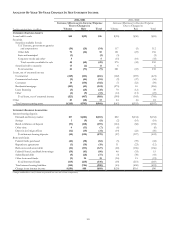
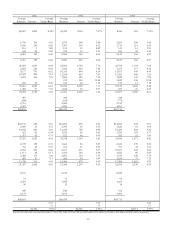
Results Of Businesses
Year ended December 31
In millions
Regional
Community
Banking
Corporate
Banking
PNC
Real Estate
Finance
PNC
Business
Credit
PNC
Advisors BlackRock PFPC Other Consolidated
2002
INCOME STATEMENT
Net interest income $1
,
403 $344 $116 $134 $100 $9 $
(
71
)
$162 $2
,
197
Noninterest income 773 437 112 48 554 577 810
(
114
)
3
,
197
T
otal revenue 2
,
176 781 228 182 654 586 739 48 5
,
394
Provision for credit losses 52 203
(
10
)
64 4
(
4
)
309
Depreciation and amortization 35 11 7 1 10 20 12 73 169
Other noninterest expense 1,026 348 153 52 487 342 619 31 3,058
Earnings before minority
interest and income taxes 1,063 219 78 65 153 224 108 (52) 1,858
Minority interest in income of
consolidated entities (2) 39 37
Income taxes 366 69
(
10
)
25 56 91 43
(
19
)
621
Earnings $697 $150 $90 $40 $97 $133 $65 $(72) $1,200
Inter-segment revenue $20 $7 $38 $16 $8 $(89)
AVERAGE ASSETS $38,976 $13,807 $5,018 $3,837 $2,929 $864 $1,888 $(730) $66,589
2001
INCOME S
T
ATEMENT
Net interest income $1
,
460 $501 $116 $104 $128 $11 $
(
66
)
$8 $2
,
262
Noninterest income 758 32 89
(
8
)
607 533 834
(
193
)
2
,
652
T
otal revenue 2
,
218 533 205 96 735 544 768
(
185
)
4
,
914
Provision for credit losses 50 733 44 29 2 45 903
Depreciation and amortization 71 13 22 2 17 26 45 77 273
Other noninterest expense 1,169 374 136 29 487 337 662 (53) 3,141
Earnings before minority
interest and income taxes 928 (587) 3 36 229 181 61 (254) 597
Minority interest in income of
consolidated entities 33 33
Income taxes 332
(
212
)
(
35
)
14 86 74 25
(
97
)
187
Earnings $596 $(375) $38 $22 $143 $107 $36 $(190) $377
Inter-segment revenue $11 $4 $61 $16 $6 $(98)
AVERAGE ASSETS $40,285 $16,685 $5,290 $2,463 $3,330 $684 $1,771 $(74) $70,434
2000
INCOME S
T
ATEMENT
Net interest income $1
,
408 $582 $118 $99 $136 $7 $
(
46
)
$
(
140
)
$2
,
164
Noninterest income 619 254 108 20 656 477 715 101 2
,
950
T
otal revenue 2
,
027 836 226 119 792 484 669
(
39
)
5
,
114
Provision for credit losses 45 79
(
7
)
12 5 2 136
Depreciation and amortization 71 13 20 2 14 20 49 70 259
Other noninterest expense 1,000 381 125 28 497 314 542 (43) 2,844
Earnings before minority
interest and income taxes 911 363 88 77 276 150 78 (68) 1,875
Minority interest in income of
consolidated entities 27 27
Income taxes 321 122 4 28 103 63 31
(
38
)
634
Earnings $590 $241 $84 $49 $173 $87 $47 $(57) $1,214
Inter-se
g
ment revenue $3 $5 $79 $13 $5 $
(
105
)
AVERAGE ASSETS $38,958 $17,746 $5,889 $2,271 $3,500 $537 $1,578 $(1,913) $68,566
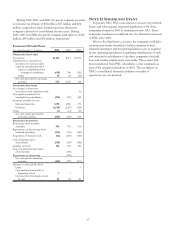
Certain revenue and expense amounts shown above differ from amounts included in the “Review of Business” section of the
Financial Review portion of this Annual Report due to classification differences and the presentation in the Financial Review of
business revenues on a taxable-equivalent basis (except for BlackRock and PFPC).