PNC Bank 2002 Annual Report Download - page 93
Download and view the complete annual report
Please find page 93 of the 2002 PNC Bank annual report below. You can navigate through the pages in the report by either clicking on the pages listed below, or by using the keyword search tool below to find specific information within the annual report.-
 1
1 -
2
-
3
-
4
-
5
-
6
-
7
-
8
-
9
-
10
-
11
-
12
-
13
-
14
-
15
-
16
-
17
-
18
-
19
-
20
-
21
-
22
-
23
-
24
-
25
-
26
-
27
-
28
-
29
-
30
-
31
-
32
-
33
-
34
-
35
-
36
-
37
-
38
-
39
-
40
-
41
-
42
-
43
-
44
-
45
-
46
-
47
-
48
-
49
-
50
-
51
-
52
-
53
-
54
-
55
-
56
-
57
-
58
-
59
-
60
-
61
-
62
-
63
-
64
-
65
-
66
-
67
-
68
-
69
-
70
-
71
-
72
-
73
-
74
-
75
-
76
-
77
-
78
-
79
-
80
-
81
-
82
-
 83
83 -
 84
84 -
 85
85 -
 86
86 -
 87
87 -
 88
88 -
 89
89 -
 90
90 -
 91
91 -
 92
92 -
 93
93 -
 94
94 -
 95
95 -
 96
96 -
 97
97 -
 98
98 -
 99
99 -
 100
100 -
 101
101 -
 102
102 -
 103
103 -
104
-
105
-
106
-
107
-
108
-
109
-
110
-
111
-
112
-
113
-
114
-
115
-
116
-
117
 |
 |

91
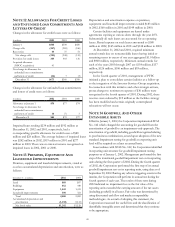
securities increased the liquidity of the assets and was
consistent with PNC’s on-going balance sheet restructuring.
At the time of the residential mortgage securitization, gains
of $25.9 million were deferred and were recognized when
principal payments were received or the securities sold to third
parties. At December 31, 2001, these securities had been
reduced to $1.3 billion through sales and principal payments
and the remaining deferred gains were $7.8 million. In the first
quarter of 2002, the remaining securities were sold. The
deferred gain remaining at the time of sale of $6.0 million was
recognized as other noninterest income.
No gain was recognized at the time of the commercial
mortgage loan securitization and none of the securities
retained at the time of the securitization remained on the
balance sheet at December 31, 2001.
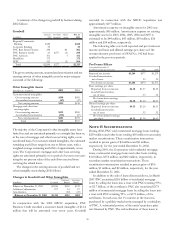
In addition to the securities discussed above, the
Corporation retained certain interest-only strips and servicing
rights that were created in the sale of certain loans and
securities. Additional information on these items is contained
below.
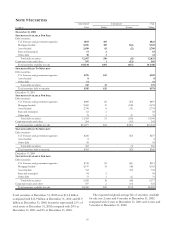
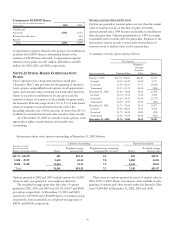
Key economic assumptions used in measuring the fair
value of the interest-only strips and servicing rights at the date
of the securitization resulting from securitizations completed
during the year and related information were as follows:
Key Economic Assumptions
Dollars in millions Fair Value
Weighted-
average Life
(Years)
Prepayment
Speed
(CPR)(a) Discount Rate
During 2002
Residential
mortgage $7 1.2 – 1.5 60.0% 7.50%
Commercial
mortgage 3 30.0 10.0 10.00 – 12.00
Other 2 2.4 (b) 4.14
During 2001
Residential
mortgage $38 1.2 – 1.7 36.0
%
10.00%
Commercial
mortgage 5 9.4 10.0 10.00
Other 21.9
(b) 4.14
(a) Constant Prepayment Rate (“CPR”).
(b) Historically, there have been no prepayments on these loans, which are guaranteed by an
agency of the U. S. Government.
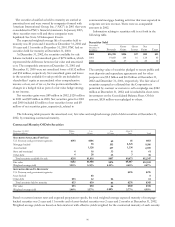
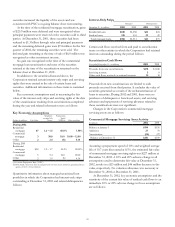
Quantitative information about managed securitized loan
portfolios in which the Corporation had interest-only strips
outstanding at December 31, 2002 and related delinquencies
follows:
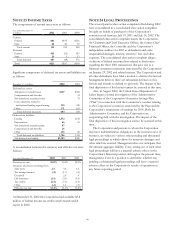
Interest-Only Strips
Managed Delinquencies
December 31 - in millions 2002 2001 2002 2001
Residential loans $650 $1,058 $22 $24
Student loans 338 453 39 49
Total managed loans $988 $1,511 $61 $73
Certain cash flows received from and paid to securitization
trusts or other entities in which the Corporation had retained
interests outstanding during the period follows:
Securitization Cash Flows
Year ended December 31 – in millions 2002 2001
Proceeds from new securitizations $278 $1,040
Servicing revenue 58
Other cash flows received on retained interests 12 16
Proceeds from new securitizations are limited to cash
proceeds received from third parties. It excludes the value of
securities generated as a result of the recharacterization of
loans to securities. During 2002 and 2001, there were no
purchases of delinquent or foreclosed assets, and servicing
advances and repayments of servicing advances related to
these securitizations were not significant.
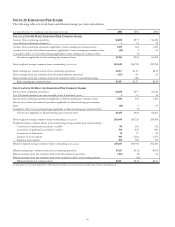
Changes in the Corporation’s commercial mortgage
servicing assets are as follows:
Commercial Mortgage Servicing Asset Activity
In millions 2002 2001
Balance at January 1 $199 $156
Additions 27 70
Amortization (25) (27)
Balance at December 31 $201 $199
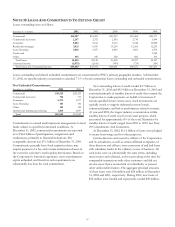
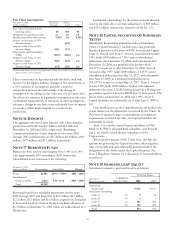
Assuming a prepayment speed of 10% and weighted average
life of 10.7 years discounted at 8.5%, the estimated fair value
of commercial mortgage servicing rights was $227 million at
December 31, 2002. A 10% and 20% adverse change in all
assumptions used to determine fair value at December 31,
2002, results in a $23 million and $46 million decrease in fair
value, respectively. No valuation allowance was necessary at
December 31, 2002 or December 31, 2001.
At December 31, 2002, key economic assumptions and the
sensitivity of the current fair value of residual cash flows to an
immediate 10% or 20% adverse change in those assumptions
are as follows: