PNC Bank 2002 Annual Report Download - page 28
Download and view the complete annual report
Please find page 28 of the 2002 PNC Bank annual report below. You can navigate through the pages in the report by either clicking on the pages listed below, or by using the keyword search tool below to find specific information within the annual report.-
 1
1 -
2
-
3
-
4
-
5
-
6
-
7
-
8
-
9
-
10
-
11
-
12
-
13
-
14
-
15
-
16
-
17
-
 18
18 -
 19
19 -
 20
20 -
 21
21 -
 22
22 -
 23
23 -
 24
24 -
 25
25 -
 26
26 -
 27
27 -
 28
28 -
 29
29 -
 30
30 -
 31
31 -
 32
32 -
 33
33 -
 34
34 -
 35
35 -
 36
36 -
 37
37 -
 38
38 -
39
-
40
-
41
-
42
-
43
-
44
-
45
-
46
-
47
-
48
-
49
-
50
-
51
-
52
-
53
-
54
-
55
-
56
-
57
-
58
-
59
-
60
-
61
-
62
-
63
-
64
-
65
-
66
-
67
-
68
-
69
-
70
-
71
-
72
-
73
-
74
-
75
-
76
-
77
-
78
-
79
-
80
-
81
-
82
-
83
-
84
-
85
-
86
-
87
-
88
-
89
-
90
-
91
-
92
-
93
-
94
-
95
-
96
-
97
-
98
-
99
-
100
-
101
-
102
-
103
-
104
-
105
-
106
-
107
-
108
-
109
-
110
-
111
-
112
-
113
-
114
-
115
-
116
-
117
 |
 |

FINANCIAL REVIEW
26
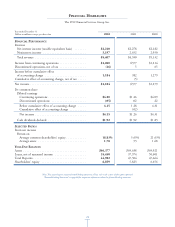
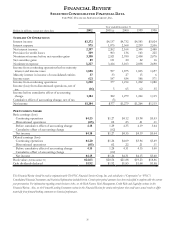
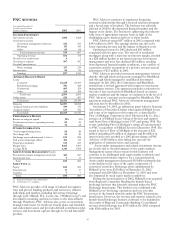
SELECTED CONSOLIDATED FINANCIAL DATA
THE PNC FINANCIAL SERVICES GROUP, INC.
Year ended December 31
Dollars in millions, except per share data 2002 2001(a) 2000 1999 1998
SUMMARY OF OPERATIONS
Interest income $3,172 $4,137 $4,732 $4,583 $5,024
Interest expense 975 1,875 2,568 2,239 2,536
Net interest income 2
,
197 2
,
262 2
,
164 2
,
344 2
,
488
Provision for credit losses 309 903 136 163 225
Noninterest income before net securities gains 3,108 2,521 2,930 2,438 2,076
Net securities gains 89 131 20 22 16
Noninterest expense 3,227 3,414 3,103 2,838 2,698
Income from continuing operations before minority
interest and income taxes 1,858 597 1,875 1,803 1,657
Minority interest in income of consolidated entities 37 33 27 15 6
Income taxes 621 187 634 586 571
Income from continuing operations 1,200 377 1,214 1,202 1,080
Income (loss) from discontinued operations, net of
tax (16) 5656235
Income before cumulative effect of accounting
change 1,184 382 1,279 1,264 1,115
Cumulative effect of accounting change, net of tax (5)
Net income $1,184 $377 $1,279 $1,264 $1,115
PER COMMON SHARE
Basic earnings (loss)
Continuing operations $4.23 $1.27 $4.12 $3.98 $3.53
Discontinued operations (.05) .02 .23 .21 .11
Before cumulative effect of accounting change 4.18 1.29 4.35 4.19 3.64
Cumulative effect of accounting change (.02)
Net income $4.18 $1.27 $4.35 $4.19 $3.64
Diluted earnings (loss)
Continuing operations $4.20 $1.26 $4.09 $3.94 $3.49
Discontinued operations (.05) .02 .22 .21 .11
Before cumulative effect of accounting change 4.15 1.28 4.31 4.15 3.60
Cumulative effect of accounting change (.02)
Net income $4.15 $1.26 $4.31 $4.15 $3.60
Book value
(
At December 31
)
$24.03 $20.54 $21.88 $19.23 $18.86
Cash dividends declared $1.92 $1.92 $1.83 $1.68 $1.58
This Financial Review should be read in conjunction with The PNC Financial Services Group, Inc. and subsidiaries (“Corporation” or “PNC”)
Consolidated Financial Statements and Statistical Information included herein. Certain prior-period amounts have been reclassified to conform with the current
year presentation. For information regarding certain business risks, see the Risk Factors, Risk Management, Credit Risk and Liquidity sections in this
Financial Review. Also, see the Forward-Looking Statements section in this Financial Review for certain other factors that could cause actual results to differ
materially from forward-looking statements or historical performance.