PNC Bank 2002 Annual Report Download - page 67
Download and view the complete annual report
Please find page 67 of the 2002 PNC Bank annual report below. You can navigate through the pages in the report by either clicking on the pages listed below, or by using the keyword search tool below to find specific information within the annual report.-
 1
1 -
2
-
3
-
4
-
5
-
6
-
7
-
8
-
9
-
10
-
11
-
12
-
13
-
14
-
15
-
16
-
17
-
18
-
19
-
20
-
21
-
22
-
23
-
24
-
25
-
26
-
27
-
28
-
29
-
30
-
31
-
32
-
33
-
34
-
35
-
36
-
37
-
38
-
39
-
40
-
41
-
42
-
43
-
44
-
45
-
46
-
47
-
48
-
49
-
50
-
51
-
52
-
53
-
54
-
55
-
56
-
 57
57 -
 58
58 -
 59
59 -
 60
60 -
 61
61 -
 62
62 -
 63
63 -
 64
64 -
 65
65 -
 66
66 -
 67
67 -
 68
68 -
 69
69 -
 70
70 -
 71
71 -
 72
72 -
 73
73 -
 74
74 -
 75
75 -
 76
76 -
 77
77 -
78
-
79
-
80
-
81
-
82
-
83
-
84
-
85
-
86
-
87
-
88
-
89
-
90
-
91
-
92
-
93
-
94
-
95
-
96
-
97
-
98
-
99
-
100
-
101
-
102
-
103
-
104
-
105
-
106
-
107
-
108
-
109
-
110
-
111
-
112
-
113
-
114
-
115
-
116
-
117
 |
 |
65
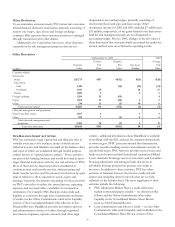
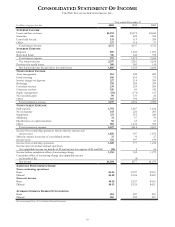
Noninterest Expense
Noninterest expense was $3.414 billion for 2001 compared
with $3.103 billion for 2000. Costs to exit the vehicle leasing
business, including the impairment of goodwill associated with
a prior acquisition and employee severance costs, and
additions to reserves related to insured residual value
exposures totaled $135 million and are included in 2001
noninterest expense. In addition, $56 million of integration
and severance costs related to other strategic initiatives were
incurred in 2001. Excluding these items, noninterest expense
increased 4% compared with 2000. The increase was primarily
in businesses that have shown higher revenue growth
including Regional Community Banking, BlackRock and
PFPC. Average full-time equivalent employees totaled
approximately 24,500 and 24,100 for 2001 and 2000,
respectively. The increase was mainly in asset management and
processing businesses.
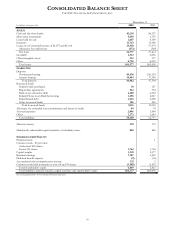
CONSOLIDATED BALANCE SHEET REVIEW
Loans
Loans were $38.0 billion at December 31, 2001, a decrease of
$12.6 billion from year end 2000 primarily due to residential
mortgage securitizations and runoff, transfers to held for sale
and the managed reduction of institutional loans. Loans at
December 31, 2001 included $1.9 billion of vehicle leases and
$200 million of commercial loans that have been designated
for exit.
Loans Held For Sale
Loans held for sale were $4.2 billion at December 31, 2001
compared with $1.7 billion at December 31, 2000. In the
fourth quarter of 2001, PNC designated for exit $3.1 billion of
loans and $7.9 billion of institutional credit exposure. Of these
amounts, $2.3 billion, net of $.6 billion of related charges, with
total credit exposure of $4.6 billion were transferred to loans
held for sale. Approximately $276 million of loans held at
December 31, 2001 by companies formed with AIG are
classified in the consolidated financial statements as loans held
for sale.
Securities
Total securities at December 31, 2001 were $13.9 billion
compared with $5.9 billion at December 31, 2000. Total
securities represented 20% of total assets at December 31,
2001 compared with 8% at December 31, 2000. The increase
was primarily due to purchases of mortgage-backed and asset-
backed securities during 2001 and the retention of interests
from the securitization of residential mortgage loans as loans
declined and were replaced with securities. At December 31,
2001, the securities available for sale balance included a net
unrealized loss of $132 million, which represented the
difference between fair value and amortized cost. The
comparable amount at December 31, 2000 was a net
unrealized loss of $54 million. The expected weighted-average
life of securities available for sale was 4 years at December 31,
2001 compared with 4 years and 5 months at December 31,
2000.
The expected weighted-average life of securities held to
maturity was 18 years and 11 months at December 31, 2001.
PNC had no securities held for maturity at December 31,
2000. The securities classified as held to maturity are carried at
amortized cost and are owned by companies formed with AIG
in 2001 that are consolidated in PNC’s financial statements.
Funding Sources
Total funding sources were $59.4 billion at December 31, 2001
and 2000. The change in the composition of borrowed funds
reflected a shift within categories to manage overall funding
costs.
Total deposits were $47.3 billion at December 31, 2001
compared with $47.7 billion at December 31, 2000. Demand
and money market deposits increased due to ongoing strategic
marketing efforts to retain customers, as higher-cost, less
valuable retail certificates of deposit were de-emphasized.
Asset Quality
Nonperforming assets were $391 million at December 31,
2001 compared with $372 million at December 31, 2000. The
ratio of nonperforming assets to total loans, loans held for sale
and foreclosed assets was .93% at December 31, 2001
compared with .71% at December 31, 2000. The allowance
for credit losses was $560 million and represented 1.47% of
total loans and 265% of nonperforming loans at December 31,
2001. The comparable amounts were $598 million, 1.18% and
185%, respectively, at December 31, 2000.
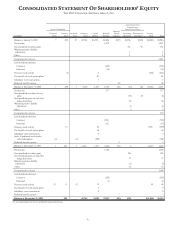
Capital
Shareholders’ equity totaled $5.8 billion at December 31, 2001
compared with $6.7 billion at December 31, 2000. The
payment of dividends, the impact of share buybacks, the
retirement of preferred stock and lower earnings in 2001
accounted for the decline. During 2001, PNC repurchased 9.5
million shares of common stock through open market or
privately negotiated transactions and purchased or redeemed
preferred stock for $301 million. The regulatory capital ratios
were 6.8% for leverage, 7.8% for tier I risk-based and 11.8%
for total risk-based capital at December 31, 2001 compared
with 8.0% for leverage, 8.6% for tier I risk-based and 12.6%
for total risk-based capital at December 31, 2000.