PNC Bank 2002 Annual Report Download - page 70
Download and view the complete annual report
Please find page 70 of the 2002 PNC Bank annual report below. You can navigate through the pages in the report by either clicking on the pages listed below, or by using the keyword search tool below to find specific information within the annual report.-
 1
1 -
2
-
3
-
4
-
5
-
6
-
7
-
8
-
9
-
10
-
11
-
12
-
13
-
14
-
15
-
16
-
17
-
18
-
19
-
20
-
21
-
22
-
23
-
24
-
25
-
26
-
27
-
28
-
29
-
30
-
31
-
32
-
33
-
34
-
35
-
36
-
37
-
38
-
39
-
40
-
41
-
42
-
43
-
44
-
45
-
46
-
47
-
48
-
49
-
50
-
51
-
52
-
53
-
54
-
55
-
56
-
57
-
58
-
59
-
 60
60 -
 61
61 -
 62
62 -
 63
63 -
 64
64 -
 65
65 -
 66
66 -
 67
67 -
 68
68 -
 69
69 -
 70
70 -
 71
71 -
 72
72 -
 73
73 -
 74
74 -
 75
75 -
 76
76 -
 77
77 -
 78
78 -
 79
79 -
 80
80 -
81
-
82
-
83
-
84
-
85
-
86
-
87
-
88
-
89
-
90
-
91
-
92
-
93
-
94
-
95
-
96
-
97
-
98
-
99
-
100
-
101
-
102
-
103
-
104
-
105
-
106
-
107
-
108
-
109
-
110
-
111
-
112
-
113
-
114
-
115
-
116
-
117
 |
 |

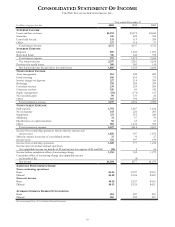
CONSOLIDATED STATEMENT OF INCOME
THE PNC FINANCIAL SERVICES GROUP, INC.
68
Year ended December 31
In millions, except per share data 2002 2001 2000
INTEREST INCOME
Loans and fees on loans $2,294 $3,279 $4,045
Securities 616 625 386
Loans held for sale 135 119 204
Other 127 114 97
Total interest income 3,172 4,137 4,732
INTEREST EXPENSE
Deposits 659 1,229 1,653
Borrowed funds 316 646 915
Total interest expense 975 1,875 2,568
Net interest income 2,197 2,262 2,164
Provision for credit losses 309 903 136
Net interest income less provision for credit losses 1,888 1,359 2,028
NONINTEREST INCOME
Asset management 853 848 809
Fund servicing 816 833 713
Service charges on deposits 227 218 206
Brokerage 195 206 249
Consumer services 239 229 209
Corporate services 526 60 342
Equity management (51) (179) 133
Net securities gains 89 131 20
Other 303 306 269
Total noninterest income 3,197 2,652 2,950
NONINTEREST EXPENSE
Staff expense 1,701 1,667 1,616
Net occupancy 243 220 203
Equipment 271 255 224
Marketing 51 57 70
Distributions on capital securities 58 63 67
Other 903 1,152 923
Total noninterest expense 3,227 3,414 3,103
Income from continuing operations before minority interest and
income taxes 1,858 597 1,875
Minority interest in income of consolidated entities 37 33 27
Income taxes 621 187 634
Income from continuing operations 1,200 377 1,214
Income (loss) from discontinued operations
(less applicable income tax benefit of $9 and income tax expense of $0 and $44) (16) 565
Income before cumulative effect of accounting change 1,184 382 1,279
Cumulative effect of accounting change (less applicable income
tax benefit of $2) (5)
Net income $1,184 $377 $1,279
EARNINGS PER COMMON SHARE
From continuing operations
Basic $4.23 $1.27 $4.12
Diluted $4.20 $1.26 $4.09
From net income
Basic $4.18 $1.27 $4.35
Diluted $4.15 $1.26 $4.31
AVERAGE COMMON SHARES OUTSTANDING
Basic 283 287 290
Diluted 285 290 293
See accompanying Notes To Consolidated Financial Statements.