PNC Bank 2002 Annual Report Download - page 34
Download and view the complete annual report
Please find page 34 of the 2002 PNC Bank annual report below. You can navigate through the pages in the report by either clicking on the pages listed below, or by using the keyword search tool below to find specific information within the annual report.-
 1
1 -
2
-
3
-
4
-
5
-
6
-
7
-
8
-
9
-
10
-
11
-
12
-
13
-
14
-
15
-
16
-
17
-
18
-
19
-
20
-
21
-
22
-
23
-
 24
24 -
 25
25 -
 26
26 -
 27
27 -
 28
28 -
 29
29 -
 30
30 -
 31
31 -
 32
32 -
 33
33 -
 34
34 -
 35
35 -
 36
36 -
 37
37 -
 38
38 -
 39
39 -
 40
40 -
 41
41 -
 42
42 -
 43
43 -
 44
44 -
45
-
46
-
47
-
48
-
49
-
50
-
51
-
52
-
53
-
54
-
55
-
56
-
57
-
58
-
59
-
60
-
61
-
62
-
63
-
64
-
65
-
66
-
67
-
68
-
69
-
70
-
71
-
72
-
73
-
74
-
75
-
76
-
77
-
78
-
79
-
80
-
81
-
82
-
83
-
84
-
85
-
86
-
87
-
88
-
89
-
90
-
91
-
92
-
93
-
94
-
95
-
96
-
97
-
98
-
99
-
100
-
101
-
102
-
103
-
104
-
105
-
106
-
107
-
108
-
109
-
110
-
111
-
112
-
113
-
114
-
115
-
116
-
117
 |
 |

32
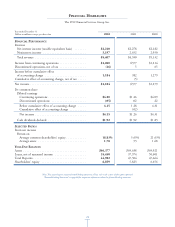
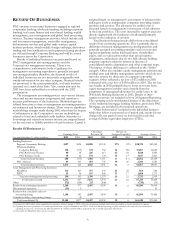
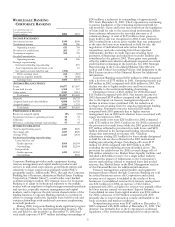
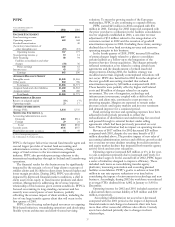
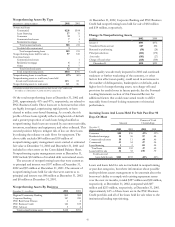
WHOLESALE BANKING
CORPORATE BANKING
Year ended December 31
Taxable-equivalent basis
Dollars in millions 2002 2001
INCOME STATEMENT
Net interest income $349 $508
Noninterest income 282 256
Operating revenue 631 764
Provision for credit losses 203 57
Noninterest expense 359 378
Goodwill amortization 3
O
p
eratin
g
income 69 326
Strategic repositioning:
Institutional lending repositioning 891
Asset impairment and severance costs 16
Net (gains) on loans held for sale (155)
Pretax earnings (loss) 224 (581)
Income tax expense (benefit) 74 (206)
Earnings (loss) $150 $(375)
AVERAGE BALANCE SHEET
Loans $9,477 $13,907
Loans held for sale 1,369 367
Other assets 2,961 2,411
Total assets $13,807 $16,685
Deposits $4,683 $4,729
Assigned funds and other liabilities 8,088 10,705
Assigned capital 1,036 1,251
Total funds $13,807 $16,685
PERFORMANCE RATIOS
Return on assigned capital 14% (30)%
Noninterest income to operating revenue 45 34
Efficiency 46 71
Efficiency, excluding strategic repositioning 57 49
OTHER INFORMATION
Total nonperforming assets $187 $220
Net charge-offs $137 $209
Average FTEs 2,123 2,424
Institutional lending repositioning
Loans held for sale
Credit exposure $564 $4,594
Outstandings $245 $2,294
Exit portfolio
Credit exposure $413 $2,262
Outstandings $192
Corporate Banking provides credit, equipment leasing,
treasury management and capital markets products and
services to mid-sized corporations, government entities and
selectively to large corporations primarily within PNC’s
geographic region. Additionally, PNC, through the Corporate
Banking line of business, administers Market Street Funding
Corporation (“Market Street”), a multi-seller asset-backed
commercial paper conduit. The strategic focus for Corporate
Banking is to adapt its institutional expertise to the middle
market with an emphasis on higher-margin noncredit products
and services, especially treasury management and capital
markets, and to improve the risk/return characteristics of the
lending business. Corporate Banking intends to continue its
efforts to manage credit risk, liquidate loans held for sale and
sustain relationships with traditional customers emphasizing
noncredit products.
During 2002, Corporate Banking made significant progress
in the repositioning of its institutional lending business. The
exit and held for sale portfolios at December 31, 2002 had
total credit exposure of $977 million including outstandings of
$245 million, a reduction in outstandings of approximately
90% from December 31, 2001. The Corporation is continuing
to pursue liquidation of the remaining institutional held for
sale portfolio. Gains and losses may result from the liquidation
of loans held for sale to the extent actual performance differs
from estimates inherent in the recorded amounts or if
valuations change. A total of $155 million of net gains on
loans held for sale was recognized in 2002. Gains realized in
2002 resulted from a more active market than was anticipated
at the time the loans were transferred to held for sale, the
negotiation of individual loan sales rather than bulk
transactions, and sales occurring faster than expected.
Additionally, declines in credit exposure resulting from
payments, refinancings and reductions in credit facilities also
contributed to the gains in 2002. These gains were partially
offset by additional valuation adjustments required on certain
credit facilities remaining in the portfolio. See 2001 Strategic
Repositioning in the Consolidated Balance Sheet Review
section and Critical Accounting Policies And Judgments in the
Risk Factors section of this Financial Review for additional
information.
Corporate Banking earned $150 million in 2002 compared
with a net loss of $375 million in 2001. Operating income was
$69 million in 2002 compared with $326 million in 2001. The
decline was due to higher credit costs and lower revenue
attributable to the institutional lending downsizing.
Operating revenue of $631 million for 2002 decreased
$133 million compared with 2001. Net interest income for
2002 decreased $159 million compared with 2001 primarily
due to the impact on treasury management deposits of a
decline in interest rates combined with the reduction in
average loans resulting from the ongoing institutional lending
downsizing. Noninterest income increased $26 million
compared with 2001 primarily due to higher treasury
management fees in 2002 and valuation losses associated with
equity investments in 2001.
Total credit costs were $203 million for 2002 compared
with $733 million for 2001. Credit costs for 2002 consisted of
the provision for credit losses while the 2001 period included
$57 million reflected in provision for credit losses and $676
million reflected in the institutional lending repositioning
charge that represented net charge-offs. Valuation
adjustments totaling $215 million for loans already designated
as held for sale are also reflected in the 2001 institutional
lending repositioning charge. Net charge-offs were $137
million for 2002 compared with $209 million in 2001
excluding the repositioning amount described above. The
provision for credit losses for 2002 covered charge-offs of
$90 million related to two Market Street liquidity facilities and
included a $24 million reserve for a single airline industry
credit and the impact of refinements to the Corporation’s
reserve methodology related to impaired loans and pooled
reserves. See Market Street in the Risk Management section
of this Financial Review for additional information.
Treasury management, capital markets and equipment
leasing products offered through Corporate Banking are sold
by several businesses across the Corporation and related
revenue net of expense is included in the results of those
businesses. Consolidated revenue from treasury management
was $343 million for 2002, an increase of $12 million
compared with 2001, as higher fee revenue was partially offset
by lower income earned on customers’ deposit balances.
Consolidated revenue from capital markets was $104 million
for 2002, a decrease of $19 million compared with 2001
primarily due to lower transaction volume attributable to the
weak economic and market conditions.
Nonperforming assets were $187 million at December 31,
2002 compared with $220 million at December 31, 2001. The
decrease was primarily due to the Corporation’s continued
liquidation of the institutional lending held for sale portfolio.