PNC Bank 2002 Annual Report Download - page 109
Download and view the complete annual report
Please find page 109 of the 2002 PNC Bank annual report below. You can navigate through the pages in the report by either clicking on the pages listed below, or by using the keyword search tool below to find specific information within the annual report.-
 1
1 -
2
-
3
-
4
-
5
-
6
-
7
-
8
-
9
-
10
-
11
-
12
-
13
-
14
-
15
-
16
-
17
-
18
-
19
-
20
-
21
-
22
-
23
-
24
-
25
-
26
-
27
-
28
-
29
-
30
-
31
-
32
-
33
-
34
-
35
-
36
-
37
-
38
-
39
-
40
-
41
-
42
-
43
-
44
-
45
-
46
-
47
-
48
-
49
-
50
-
51
-
52
-
53
-
54
-
55
-
56
-
57
-
58
-
59
-
60
-
61
-
62
-
63
-
64
-
65
-
66
-
67
-
68
-
69
-
70
-
71
-
72
-
73
-
74
-
75
-
76
-
77
-
78
-
79
-
80
-
81
-
82
-
83
-
84
-
85
-
86
-
87
-
88
-
89
-
90
-
91
-
92
-
93
-
94
-
95
-
96
-
97
-
98
-
 99
99 -
 100
100 -
 101
101 -
 102
102 -
 103
103 -
 104
104 -
 105
105 -
 106
106 -
 107
107 -
 108
108 -
 109
109 -
 110
110 -
 111
111 -
 112
112 -
 113
113 -
 114
114 -
 115
115 -
 116
116 -
 117
117
 |
 |

107
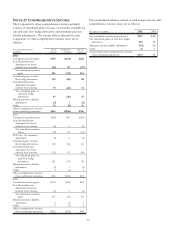
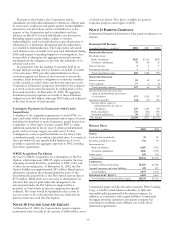
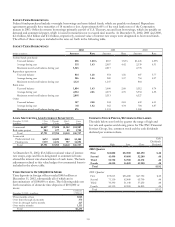
During 2002, 2001 and 2000, the parent company received
net income tax refunds of $36 million, $37 million and $36
million, respectively. Such refunds represent the parent
company’s portion of consolidated income taxes. During
2002, 2001 and 2000, the parent company paid interest of $45
million, $49 million and $56 million, respectively.
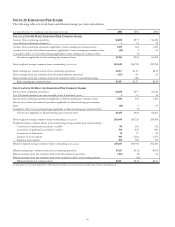
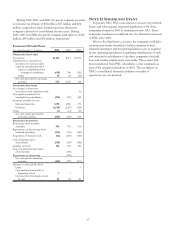
Statement Of Cash Flows
Year ended December 31 - in millions 2002 2001 2000
OPERATING ACTIVITIES
Net income $1,184 $377 $1,279
Adjustments to reconcile net
income to net cash provided
(used) by operating activities:
Equity in undistributed net
earnings of subsidiaries (659) 768 (551)
Other 10 44 (24)
Net cash provided by operating
activities 535 1,189 704
INVESTING ACTIVITIES
Net change in short-term
investments with subsidiary bank 16
Net capital (contributed to)
returned from subsidiaries (125) (237) 258
Securities available for sale
Sales and maturities 1,556 1,206 372
Purchases (1,655) (1,247) (425)
Other (1) (14) (13)
Net cash (used) provided by
investing activities (225) (292) 208
FINANCING ACTIVITIES
Borrowings from nonbank
subsidiary 393 763 314
Repayments on borrowings from
nonbank subsidiary (223) (190) (440)
Acquisition of treasury stock (62) (681) (428)
Cash dividends paid to
shareholders (546) (569) (546)
Issuance of stock 128 181 189
Series F preferred stock tender
offer/maturity (301)
Repayments on borrowings (100)
Net cash used by financing
activities (310) (897) (911)
Increase in cash and due from
banks 1
Cash and due from banks at
beginning of year 11
Cash and due from banks at end
of year $1 $1 $1
NOTE 32 SUBSEQUENT EVENT
In January 2003, PNC took actions to convert its preferred
shares and subsequently requested liquidation of the three
companies formed in 2001 in transactions with AIG. These
companies had been consolidated into the financial statements
of PNC since 2001.
Prior to the distribution of assets, the companies sold debt
securities previously classified as held to maturity in their
financial statements and incurred liquidation costs as required
by the operating agreements. Liquidating distributions of cash
and interests in subsidiaries of the three companies that held
loan and venture capital assets were made. These assets had
been transferred from PNC subsidiaries to the companies as
part of the original transactions in 2001. The net impact on
PNC’s consolidated financial condition or results of
operations was not material.