Nokia 2011 Annual Report Download - page 288
Download and view the complete annual report
Please find page 288 of the 2011 Nokia annual report below. You can navigate through the pages in the report by either clicking on the pages listed below, or by using the keyword search tool below to find specific information within the annual report.-
 1
1 -
2
-
3
-
4
-
5
-
6
-
7
-
8
-
9
-
10
-
11
-
12
-
13
-
14
-
15
-
16
-
17
-
18
-
19
-
20
-
21
-
22
-
23
-
24
-
25
-
26
-
27
-
28
-
29
-
30
-
31
-
32
-
33
-
34
-
35
-
36
-
37
-
38
-
39
-
40
-
41
-
42
-
43
-
44
-
45
-
46
-
47
-
48
-
49
-
50
-
51
-
52
-
53
-
54
-
55
-
56
-
57
-
58
-
59
-
60
-
61
-
62
-
63
-
64
-
65
-
66
-
67
-
68
-
69
-
70
-
71
-
72
-
73
-
74
-
75
-
76
-
77
-
78
-
79
-
80
-
81
-
82
-
83
-
84
-
85
-
86
-
87
-
88
-
89
-
90
-
91
-
92
-
93
-
94
-
95
-
96
-
97
-
98
-
99
-
100
-
101
-
102
-
103
-
104
-
105
-
106
-
107
-
108
-
109
-
110
-
111
-
112
-
113
-
114
-
115
-
116
-
117
-
118
-
119
-
120
-
121
-
122
-
123
-
124
-
125
-
126
-
127
-
128
-
129
-
130
-
131
-
132
-
133
-
134
-
135
-
136
-
137
-
138
-
139
-
140
-
141
-
142
-
143
-
144
-
145
-
146
-
147
-
148
-
149
-
150
-
151
-
152
-
153
-
154
-
155
-
156
-
157
-
158
-
159
-
160
-
161
-
162
-
163
-
164
-
165
-
166
-
167
-
168
-
169
-
170
-
171
-
172
-
173
-
174
-
175
-
176
-
177
-
178
-
179
-
180
-
181
-
182
-
183
-
184
-
185
-
186
-
187
-
188
-
189
-
190
-
191
-
192
-
193
-
194
-
195
-
196
-
197
-
198
-
199
-
200
-
201
-
202
-
203
-
204
-
205
-
206
-
207
-
208
-
209
-
210
-
211
-
212
-
213
-
214
-
215
-
216
-
217
-
218
-
219
-
220
-
221
-
222
-
223
-
224
-
225
-
226
-
227
-
228
-
229
-
230
-
231
-
232
-
233
-
234
-
235
-
236
-
237
-
238
-
239
-
240
-
241
-
242
-
243
-
244
-
245
-
246
-
247
-
248
-
249
-
250
-
251
-
252
-
253
-
254
-
255
-
256
-
257
-
258
-
259
-
260
-
261
-
262
-
263
-
264
-
265
-
266
-
267
-
268
-
269
-
270
-
271
-
272
-
273
-
274
-
275
-
276
-
277
-
 278
278 -
 279
279 -
 280
280 -
 281
281 -
 282
282 -
 283
283 -
 284
284 -
 285
285 -
 286
286 -
 287
287 -
 288
288 -
 289
289 -
 290
290 -
 291
291 -
 292
292 -
 293
293 -
 294
294 -
 295
295 -
 296
296
 |
 |

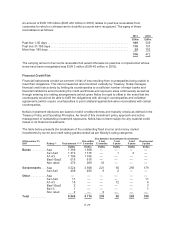
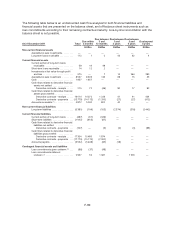
At December 31,
2010 Rating (3) Total amount (1), (2)
Due within
3 months
Due between
3 and
12 months
Due between
1 and
3 years
Due between
3 and
5 years
Due beyond
5 years
EURm EURm EURm EURm EURm EURm
Banks ......... Aaa 1152 1152 — — — —
Aa1-Aa3 1 283 1 227 52 1 — 3
A1-A3 2 971 2 942 21 2 1 5
Baa1-Baa3 340 338 — — — 2
Non rated 303 303 — — — —
Governments . . . Aaa 3 408 1 499 899 376 18 616
Aa1-Aa3 638 402 199 26 11 —
Baa1-Baa3 5 — — — 5 —
Other .......... Aaa 167 30 32 43 28 34
Aa1-Aa3 43 — 10 — 27 6
A1-A3 9 — 3 — — 6
Baa1-Baa3 2 — — — — 2
Ba1-C 1 — — — — 1
Non rated 2 — 2 — — —
Total .......... 10 324 7 893 1 218 448 90 675
(1) Fixed income and money-market investments include term deposits, investments in liquidity funds
and investments in fixed income instruments classified as available-for-sale investments and
investments at fair value through profit and loss. Liquidity funds invested solely in government
securities are included under Governments. Other liquidity funds are included under Banks.
(2) Included within fixed income and money-market investments is EUR 40 million of restricted
investment at December 31, 2011 (EUR 37 million at December 31, 2010). They are restricted
financial assets under various contractual or legal obligations.
(3) Bank parent company ratings used here for bank groups. In some emerging markets countries
actual bank subsidiary ratings may differ from parent company rating.
92% of Nokia’s cash in bank accounts is held with banks of investment grade credit rating (89% for 2010).
(c) Liquidity Risk
Liquidity risk is defined as financial distress or extraordinary high financing costs arising due to a
shortage of liquid funds in a situation where business conditions unexpectedly deteriorate and require
financing. Transactional liquidity risk is defined as the risk of executing a financial transaction below fair
market value, or not being able to execute the transaction at all, within a specific period of time.
The objective of liquidity risk management is to maintain sufficient liquidity, and to ensure that it is
available fast enough without endangering its value, in order to avoid uncertainty related to financial
distress at all times.
Nokia guarantees a sufficient liquidity at all times by efficient cash management and by investing in
short-term liquid interest bearing securities. The transactional liquidity risk is minimized by entering
transactions where proper two-way quotes can be obtained from the market.
Due to the dynamic nature of the underlying business, Nokia and Nokia Siemens Networks aim at
maintaining flexibility in funding by keeping committed and uncommitted credit lines available. Nokia
and Nokia Siemens Networks manage their respective credit facilities independently and facilities do
not include cross-default clauses between Nokia and Nokia Siemens Networks or any forms of
guarantees from either party. At the end of December 31, 2011 the committed facilities totaled
EUR 3 550 million (EUR 3 508 million in 2010).
F-78