Nokia 2011 Annual Report Download - page 269
Download and view the complete annual report
Please find page 269 of the 2011 Nokia annual report below. You can navigate through the pages in the report by either clicking on the pages listed below, or by using the keyword search tool below to find specific information within the annual report.-
 1
1 -
2
-
3
-
4
-
5
-
6
-
7
-
8
-
9
-
10
-
11
-
12
-
13
-
14
-
15
-
16
-
17
-
18
-
19
-
20
-
21
-
22
-
23
-
24
-
25
-
26
-
27
-
28
-
29
-
30
-
31
-
32
-
33
-
34
-
35
-
36
-
37
-
38
-
39
-
40
-
41
-
42
-
43
-
44
-
45
-
46
-
47
-
48
-
49
-
50
-
51
-
52
-
53
-
54
-
55
-
56
-
57
-
58
-
59
-
60
-
61
-
62
-
63
-
64
-
65
-
66
-
67
-
68
-
69
-
70
-
71
-
72
-
73
-
74
-
75
-
76
-
77
-
78
-
79
-
80
-
81
-
82
-
83
-
84
-
85
-
86
-
87
-
88
-
89
-
90
-
91
-
92
-
93
-
94
-
95
-
96
-
97
-
98
-
99
-
100
-
101
-
102
-
103
-
104
-
105
-
106
-
107
-
108
-
109
-
110
-
111
-
112
-
113
-
114
-
115
-
116
-
117
-
118
-
119
-
120
-
121
-
122
-
123
-
124
-
125
-
126
-
127
-
128
-
129
-
130
-
131
-
132
-
133
-
134
-
135
-
136
-
137
-
138
-
139
-
140
-
141
-
142
-
143
-
144
-
145
-
146
-
147
-
148
-
149
-
150
-
151
-
152
-
153
-
154
-
155
-
156
-
157
-
158
-
159
-
160
-
161
-
162
-
163
-
164
-
165
-
166
-
167
-
168
-
169
-
170
-
171
-
172
-
173
-
174
-
175
-
176
-
177
-
178
-
179
-
180
-
181
-
182
-
183
-
184
-
185
-
186
-
187
-
188
-
189
-
190
-
191
-
192
-
193
-
194
-
195
-
196
-
197
-
198
-
199
-
200
-
201
-
202
-
203
-
204
-
205
-
206
-
207
-
208
-
209
-
210
-
211
-
212
-
213
-
214
-
215
-
216
-
217
-
218
-
219
-
220
-
221
-
222
-
223
-
224
-
225
-
226
-
227
-
228
-
229
-
230
-
231
-
232
-
233
-
234
-
235
-
236
-
237
-
238
-
239
-
240
-
241
-
242
-
243
-
244
-
245
-
246
-
247
-
248
-
249
-
250
-
251
-
252
-
253
-
254
-
255
-
256
-
257
-
258
-
 259
259 -
 260
260 -
 261
261 -
 262
262 -
 263
263 -
 264
264 -
 265
265 -
 266
266 -
 267
267 -
 268
268 -
 269
269 -
 270
270 -
 271
271 -
 272
272 -
 273
273 -
 274
274 -
 275
275 -
 276
276 -
 277
277 -
 278
278 -
 279
279 -
280
-
281
-
282
-
283
-
284
-
285
-
286
-
287
-
288
-
289
-
290
-
291
-
292
-
293
-
294
-
295
-
296
 |
 |

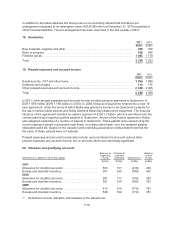
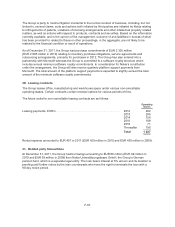
Nokia calculates the fair value of stock options using the Black-Scholes model. The fair value of the
stock options is estimated at the grant date using the following assumptions:
2011 2010 2009
Weighted average expected dividend yield ....... 7.37% 4.73% 3.63%
Weighted average expected volatility ............ 36.95% 52.09% 43.46%
Risk-free interest rate ......................... 1.71% - 2.86% 1.52% - 2.49% 1.97% - 2.94%
Weighted average risk-free interest rate .......... 2.68% 1.78% 2.23%
Expected life (years) .......................... 4.7 3.59 3.60
Weighted average share price, EUR ............. 5.46 8.27 10.82
Expected term of stock options is estimated by observing general option holder behavior and actual
historical terms of Nokia stock option plans.
Expected volatility has been set by reference to the implied volatility of options available on Nokia
shares in the open market and in light of historical patterns of volatility.
Performance shares
During 2011, Nokia administered four global performance share plans, the Performance Share Plans
of 2008, 2009, 2010 and 2011, each of which, including its terms and conditions, has been approved
by the Board of Directors.
The performance shares represent a commitment by Nokia Corporation to deliver Nokia shares to
employees at a future point in time, subject to Nokia’s fulfillment of pre-defined performance criteria.
No performance shares will vest unless the Group’s performance reaches at least one of the threshold
levels measured by two independent, pre-defined performance criteria: the Group’s average annual net
sales growth for the performance period of the plan and, in the Performance Share Plans of 2008,
2009 and 2010 earnings per share (“EPS”) at the end of the performance period and in the
Performance Share Plan 2011 average annual EPS during the performance period.
The 2008, 2009, 2010 and 2011 plans have a three-year performance period with no interim payout.
The shares vest after the respective performance period. The shares will be delivered to the
participants as soon as practicable after they vest. Until the Nokia shares are delivered, the
participants will not have any shareholder rights, such as voting or dividend rights associated with the
performance shares. The performance share grants are generally forfeited if the employment
relationship terminates with Nokia prior to vesting.
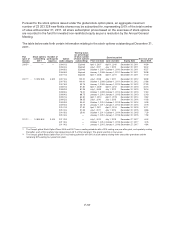
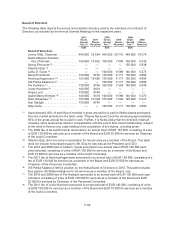
The following table summarizes our global performance share plans.
Plan
Performance
shares
outstanding
at threshold(1)(2)
Number of
participants (approx.)
Performance
period Settlement
2008 .............................. 0 5000 2008-2010 2011
2009 .............................. 0 4000 2009-2011 2012
2010 .............................. 2660445 3000 2010-2012 2013
2011 .............................. 4669530 4000 2011-2013 2014
(1) Shares under performance share plan 2009 vested on December 31, 2011 and are therefore not
included in the outstanding numbers.
(2) Does not include 2559 outstanding performance shares with deferred delivery due to leave of
absence.
F-59