Nokia 2011 Annual Report Download - page 283
Download and view the complete annual report
Please find page 283 of the 2011 Nokia annual report below. You can navigate through the pages in the report by either clicking on the pages listed below, or by using the keyword search tool below to find specific information within the annual report.-
 1
1 -
2
-
3
-
4
-
5
-
6
-
7
-
8
-
9
-
10
-
11
-
12
-
13
-
14
-
15
-
16
-
17
-
18
-
19
-
20
-
21
-
22
-
23
-
24
-
25
-
26
-
27
-
28
-
29
-
30
-
31
-
32
-
33
-
34
-
35
-
36
-
37
-
38
-
39
-
40
-
41
-
42
-
43
-
44
-
45
-
46
-
47
-
48
-
49
-
50
-
51
-
52
-
53
-
54
-
55
-
56
-
57
-
58
-
59
-
60
-
61
-
62
-
63
-
64
-
65
-
66
-
67
-
68
-
69
-
70
-
71
-
72
-
73
-
74
-
75
-
76
-
77
-
78
-
79
-
80
-
81
-
82
-
83
-
84
-
85
-
86
-
87
-
88
-
89
-
90
-
91
-
92
-
93
-
94
-
95
-
96
-
97
-
98
-
99
-
100
-
101
-
102
-
103
-
104
-
105
-
106
-
107
-
108
-
109
-
110
-
111
-
112
-
113
-
114
-
115
-
116
-
117
-
118
-
119
-
120
-
121
-
122
-
123
-
124
-
125
-
126
-
127
-
128
-
129
-
130
-
131
-
132
-
133
-
134
-
135
-
136
-
137
-
138
-
139
-
140
-
141
-
142
-
143
-
144
-
145
-
146
-
147
-
148
-
149
-
150
-
151
-
152
-
153
-
154
-
155
-
156
-
157
-
158
-
159
-
160
-
161
-
162
-
163
-
164
-
165
-
166
-
167
-
168
-
169
-
170
-
171
-
172
-
173
-
174
-
175
-
176
-
177
-
178
-
179
-
180
-
181
-
182
-
183
-
184
-
185
-
186
-
187
-
188
-
189
-
190
-
191
-
192
-
193
-
194
-
195
-
196
-
197
-
198
-
199
-
200
-
201
-
202
-
203
-
204
-
205
-
206
-
207
-
208
-
209
-
210
-
211
-
212
-
213
-
214
-
215
-
216
-
217
-
218
-
219
-
220
-
221
-
222
-
223
-
224
-
225
-
226
-
227
-
228
-
229
-
230
-
231
-
232
-
233
-
234
-
235
-
236
-
237
-
238
-
239
-
240
-
241
-
242
-
243
-
244
-
245
-
246
-
247
-
248
-
249
-
250
-
251
-
252
-
253
-
254
-
255
-
256
-
257
-
258
-
259
-
260
-
261
-
262
-
263
-
264
-
265
-
266
-
267
-
268
-
269
-
270
-
271
-
272
-
 273
273 -
 274
274 -
 275
275 -
 276
276 -
 277
277 -
 278
278 -
 279
279 -
 280
280 -
 281
281 -
 282
282 -
 283
283 -
 284
284 -
 285
285 -
 286
286 -
 287
287 -
 288
288 -
 289
289 -
 290
290 -
 291
291 -
 292
292 -
 293
293 -
294
-
295
-
296
 |
 |

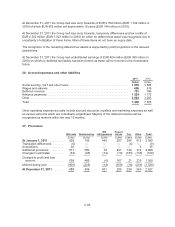
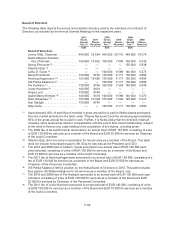
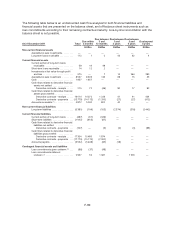
At the end of years 2011 and 2010, the following currencies represent a significant portion of the
currency mix in the outstanding financial instruments:
2011 USD JPY CNY INR
EURm EURm EURm EURm
FX derivatives used as cash flow hedges (net amount) (1) ........... 1282 110 — (20)
FX derivatives used as net investment hedges (net amount) (2) ...... (1045) (17) (2023) (818)
FX exposure from balance sheet items (net amount) (3) ............. (962) (19) 880 (109)
FX derivatives not designated in a hedge relationship and carried at
fair value through the profit and loss statement (net amount) (3) .... 875 255 (825) (264)
Cross currency / interest rate hedges ........................... 420 — — —
2010 USD JPY CNY INR
EURm EURm EURm EURm
FX derivatives used as cashflow hedges (net amount) (1) ........... (140) 521 — (23)
FX derivatives used as net investment hedges (net amount) (2) ...... (642) — (2834) (702)
FX exposure from balance sheet items (net amount) (3) ............ (1645) (245) (710) (218)
FX derivatives not designated in a hedge relationship and carried at
fair value through profit and loss (net amount) (3), (4) .............. 134 1026 1845 (117)
Cross currency / interest rate hedges ........................... 408 — — —
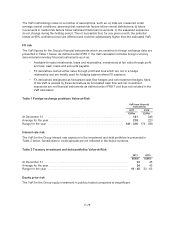
(1.) The FX derivatives are used to hedge the foreign exchange risk from forecasted highly probable
cashflows related to sales, purchases and business acquisition activities. In some of the
currencies, especially in US Dollar, Nokia has substantial foreign exchange risks in both estimated
cash inflows and outflows, which have been netted in the table. See Note 21 for more details on
hedge accounting. The underlying exposures hedged are not presented in the table, as they are
not financial instruments as defined under IFRS 7.
(2.) The FX derivatives are used to hedge the Group’s net investment exposure. The underlying
exposures hedged are not presented in the table, as they are not financial instruments as defined
under IFRS 7.
(3.) The balance sheet items and some probable forecasted cash flows which are denominated in
foreign currencies are hedged by a portion of FX derivatives not designated in a hedge
relationship and carried at fair value through the profit and loss statement.
(4.) The FX exposures for 2010 have been recalculated to include options’ nominal instead of options’
delta as a measure of exposure.
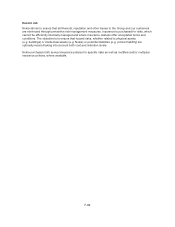
Interest rate risk
The Group is exposed to interest rate risk either through market value fluctuations of balance sheet
items (i.e. price risk) or through changes in interest income or expenses (i.e. refinancing or
reinvestment risk). Interest rate risk mainly arises through interest bearing liabilities and assets.
Estimated future changes in cash flows and balance sheet structure also expose the Group to interest
rate risk.
The objective of Interest rate risk management is to manage uncertainty caused by fluctuations in
interest rates and minimize net long-term debt funding costs.
The interest rate exposure of the Group is monitored and managed centrally. Nokia uses the
Value-at-Risk (VaR) methodology complemented by selective shock sensitivity analyses to assess and
measure the interest rate risk of interest-bearing assets, interest-bearing liabilities and related
derivatives, which together create the Group’s interest rate exposure.
F-73