Nokia 2011 Annual Report Download - page 238
Download and view the complete annual report
Please find page 238 of the 2011 Nokia annual report below. You can navigate through the pages in the report by either clicking on the pages listed below, or by using the keyword search tool below to find specific information within the annual report.-
 1
1 -
2
-
3
-
4
-
5
-
6
-
7
-
8
-
9
-
10
-
11
-
12
-
13
-
14
-
15
-
16
-
17
-
18
-
19
-
20
-
21
-
22
-
23
-
24
-
25
-
26
-
27
-
28
-
29
-
30
-
31
-
32
-
33
-
34
-
35
-
36
-
37
-
38
-
39
-
40
-
41
-
42
-
43
-
44
-
45
-
46
-
47
-
48
-
49
-
50
-
51
-
52
-
53
-
54
-
55
-
56
-
57
-
58
-
59
-
60
-
61
-
62
-
63
-
64
-
65
-
66
-
67
-
68
-
69
-
70
-
71
-
72
-
73
-
74
-
75
-
76
-
77
-
78
-
79
-
80
-
81
-
82
-
83
-
84
-
85
-
86
-
87
-
88
-
89
-
90
-
91
-
92
-
93
-
94
-
95
-
96
-
97
-
98
-
99
-
100
-
101
-
102
-
103
-
104
-
105
-
106
-
107
-
108
-
109
-
110
-
111
-
112
-
113
-
114
-
115
-
116
-
117
-
118
-
119
-
120
-
121
-
122
-
123
-
124
-
125
-
126
-
127
-
128
-
129
-
130
-
131
-
132
-
133
-
134
-
135
-
136
-
137
-
138
-
139
-
140
-
141
-
142
-
143
-
144
-
145
-
146
-
147
-
148
-
149
-
150
-
151
-
152
-
153
-
154
-
155
-
156
-
157
-
158
-
159
-
160
-
161
-
162
-
163
-
164
-
165
-
166
-
167
-
168
-
169
-
170
-
171
-
172
-
173
-
174
-
175
-
176
-
177
-
178
-
179
-
180
-
181
-
182
-
183
-
184
-
185
-
186
-
187
-
188
-
189
-
190
-
191
-
192
-
193
-
194
-
195
-
196
-
197
-
198
-
199
-
200
-
201
-
202
-
203
-
204
-
205
-
206
-
207
-
208
-
209
-
210
-
211
-
212
-
213
-
214
-
215
-
216
-
217
-
218
-
219
-
220
-
221
-
222
-
223
-
224
-
225
-
226
-
227
-
 228
228 -
 229
229 -
 230
230 -
 231
231 -
 232
232 -
 233
233 -
 234
234 -
 235
235 -
 236
236 -
 237
237 -
 238
238 -
 239
239 -
 240
240 -
 241
241 -
 242
242 -
 243
243 -
 244
244 -
 245
245 -
 246
246 -
 247
247 -
 248
248 -
249
-
250
-
251
-
252
-
253
-
254
-
255
-
256
-
257
-
258
-
259
-
260
-
261
-
262
-
263
-
264
-
265
-
266
-
267
-
268
-
269
-
270
-
271
-
272
-
273
-
274
-
275
-
276
-
277
-
278
-
279
-
280
-
281
-
282
-
283
-
284
-
285
-
286
-
287
-
288
-
289
-
290
-
291
-
292
-
293
-
294
-
295
-
296
 |
 |

2010
Smart
Devices
Mobile
Phones
Devices &
Services
Other
Devices &
Services
Location &
Commerce
Nokia
Siemens
Networks
Corporate
Common
Functions and
Corporate
unallocated(4)(6)
Elimina-
tions Group
EURm EURm EURm EURm EURm EURm EURm EURm EURm
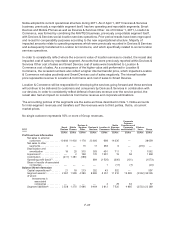
Profit and Loss Information
Net sales to external
customers .............. 14870 13696 552 29118 668 12660 — 42446
Net sales to other
segments ............... 3 — 13 16 201 1 — (218) —
Depreciation and
amortization ............ 38 17 350 405 519 843 4 1771
Impairment ............... — — — — — 2 13 15
Contribution .............. 1376 2327 (163)
Operating profit (loss) ...... 3540 (663) (686) (113) (8) 2 070
Share of results of associated
companies .............. — — — — 2 11 (12) 1
Balance Sheet Information
Capital expenditures(2) ...... 31 13 256 300 73 306 — 679
Segment assets(3) .......... 2924 1905 4725 9554 6742 10621 14754 (2548) 39 123
of which:
Investments in
associated
companies .......... — 7 42 87 136
Segment liabilities(5) ........ 3064 1417 5627 10108 3009 7190 5133 (2548) 22 892
2009
Smart
Devices
Mobile
Phones
Devices &
Services
Other
Devices &
Services
Location &
Commerce
Nokia
Siemens
Networks
Corporate
Common
Functions and
Corporate
unallocated(4)(6)
Elimina-
tions Group
EURm EURm EURm EURm EURm EURm EURm EURm EURm
Profit and Loss Information
Net sales to external
customers .............. 12640 14644 557 27841 579 12564 — 40984
Net sales to other
segments ............... 9 — 3 12 177 10 — (199) —
Depreciation and
amortization ............ 35 17 380 432 488 860 4 1784
Impairment(1) .............. — — 56 56 — 919 34 1009
Contribution .............. 1438 2240 (114)
Operating profit (loss)(1) ..... 3564 (594) (1 639) (134) 1 197
Share of results of associated
companies .............. — — — — — 32 (2) 30
(1) Location & Commerce operating loss in 2011 includes a goodwill impairment loss of EUR 1 090 million.
Nokia Siemens Networks operating loss in 2009 includes a goodwill impairment loss of EUR 908 million.
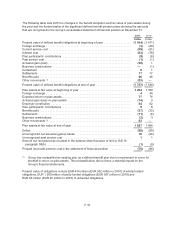
(2) Including goodwill, capital expenditures in 2011 amount to EUR 786 million (EUR 761 million in 2010). The goodwill
consists of EUR 28 million in 2011 (EUR 73 million in 2010) for Devices & Services, EUR 0 million in 2011 (EUR 9
million in 2010) for Location & Commerce, EUR 161 million in 2011 (EUR 0 million in 2010) for Nokia Siemens
Networks, and EUR 0 million in 2011 (EUR 0 million in 2010) for Corporate Common Functions.
(3) Comprises intangible assets, property, plant and equipment, investments, inventories and accounts receivable as
well as prepaid expenses and accrued income except those related to interest and taxes for Devices & Services and
Corporate Common Functions. In addition, Location & Commerce and Nokia Siemens Networks’ assets include
cash and other liquid assets, available-for-sale investments, long-term loans receivable and other financial assets as
well as interest and tax related prepaid expenses and accrued income. These are directly attributable to Location &
Commerce and Nokia Siemens Networks.
(4) Unallocated assets include cash and other liquid assets, available-for-sale investments, long-term loans receivable
and other financial assets as well as interest and tax related prepaid expenses and accrued income for Devices &
Services and Corporate Common Functions.
(5) Comprises accounts payable, accrued expenses and provisions except those related to interest and taxes for
Devices & Services and Corporate Common Functions. In addition, Location & Commerce’s and Nokia Siemens
F-28