Nokia 2011 Annual Report Download - page 121
Download and view the complete annual report
Please find page 121 of the 2011 Nokia annual report below. You can navigate through the pages in the report by either clicking on the pages listed below, or by using the keyword search tool below to find specific information within the annual report.-
 1
1 -
2
-
3
-
4
-
5
-
6
-
7
-
8
-
9
-
10
-
11
-
12
-
13
-
14
-
15
-
16
-
17
-
18
-
19
-
20
-
21
-
22
-
23
-
24
-
25
-
26
-
27
-
28
-
29
-
30
-
31
-
32
-
33
-
34
-
35
-
36
-
37
-
38
-
39
-
40
-
41
-
42
-
43
-
44
-
45
-
46
-
47
-
48
-
49
-
50
-
51
-
52
-
53
-
54
-
55
-
56
-
57
-
58
-
59
-
60
-
61
-
62
-
63
-
64
-
65
-
66
-
67
-
68
-
69
-
70
-
71
-
72
-
73
-
74
-
75
-
76
-
77
-
78
-
79
-
80
-
81
-
82
-
83
-
84
-
85
-
86
-
87
-
88
-
89
-
90
-
91
-
92
-
93
-
94
-
95
-
96
-
97
-
98
-
99
-
100
-
101
-
102
-
103
-
104
-
105
-
106
-
107
-
108
-
109
-
110
-
 111
111 -
 112
112 -
 113
113 -
 114
114 -
 115
115 -
 116
116 -
 117
117 -
 118
118 -
 119
119 -
 120
120 -
 121
121 -
 122
122 -
 123
123 -
 124
124 -
 125
125 -
 126
126 -
 127
127 -
 128
128 -
 129
129 -
 130
130 -
 131
131 -
132
-
133
-
134
-
135
-
136
-
137
-
138
-
139
-
140
-
141
-
142
-
143
-
144
-
145
-
146
-
147
-
148
-
149
-
150
-
151
-
152
-
153
-
154
-
155
-
156
-
157
-
158
-
159
-
160
-
161
-
162
-
163
-
164
-
165
-
166
-
167
-
168
-
169
-
170
-
171
-
172
-
173
-
174
-
175
-
176
-
177
-
178
-
179
-
180
-
181
-
182
-
183
-
184
-
185
-
186
-
187
-
188
-
189
-
190
-
191
-
192
-
193
-
194
-
195
-
196
-
197
-
198
-
199
-
200
-
201
-
202
-
203
-
204
-
205
-
206
-
207
-
208
-
209
-
210
-
211
-
212
-
213
-
214
-
215
-
216
-
217
-
218
-
219
-
220
-
221
-
222
-
223
-
224
-
225
-
226
-
227
-
228
-
229
-
230
-
231
-
232
-
233
-
234
-
235
-
236
-
237
-
238
-
239
-
240
-
241
-
242
-
243
-
244
-
245
-
246
-
247
-
248
-
249
-
250
-
251
-
252
-
253
-
254
-
255
-
256
-
257
-
258
-
259
-
260
-
261
-
262
-
263
-
264
-
265
-
266
-
267
-
268
-
269
-
270
-
271
-
272
-
273
-
274
-
275
-
276
-
277
-
278
-
279
-
280
-
281
-
282
-
283
-
284
-
285
-
286
-
287
-
288
-
289
-
290
-
291
-
292
-
293
-
294
-
295
-
296
 |
 |

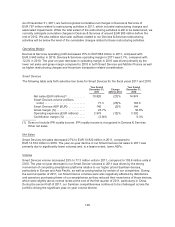
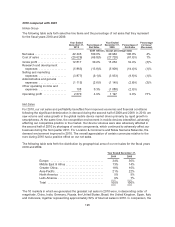
Gross Margin
Our Devices & Services gross margin in 2011 was 27.7%, compared to 29.9% in 2010. On a
year-on-year basis, the decline in our Devices & Services gross margin in 2011 was driven primarily by
gross margin declines in both Smart Devices and, to a lesser extent, in Mobile Phones, as discussed
below, which was partially offset by higher IPR royalty income.
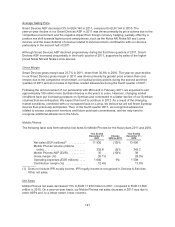
Operating Expenses
Devices & Services research and development expenses in 2011 decreased 9% to EUR 2 441 million,
compared with EUR 2 694 million in 2010. In 2011, research and development expenses represented
10.2% of Devices & Services net sales, compared with 9.2% in 2010. The decrease in Devices &
Services research and development expenses was primarily due to declines in Smart Devices and
Devices & Services Other research and development expenses, partially offset by an increase in
Mobile Phones research and development expenses. The decreases in Smart Devices and Devices &
Services Other research and development expenses were due primarily to a focus on priority projects
and cost controls. The increase in Mobile Phones research and development expenses was due
primarily to investments to accelerate product development to bring new innovations to the market
faster and at lower price-points, consistent with the Mobile Phones “internet for the next billion”
strategy. This increase was partially offset by a focus on priority projects and cost controls.
Devices & Services R&D expenses included amortization of acquired intangible assets of
EUR 8 million and EUR 10 million in 2011 and 2010, respectively.
In 2011, Devices & Services selling and marketing expenses decreased 4% to EUR 2 180 million,
compared with EUR 2 270 million in 2010. The decrease was primarily due to lower Smart Devices
sales and marketing expenses. In 2011, selling and marketing expenses represented 9.1% of
Devices & Services net sales, compared with 7.8% of its net sales in 2010.
Devices & Services administrative and general expenses in 2011 decreased 7% to EUR 362 million,
compared with EUR 388 million in 2010. The decrease in Devices & Services administrative and
general expenses was primarily driven by lower Smart Devices administrative and general expenses
which more than offset an increase in Devices & Services Other administrative and general expenses.
In 2011, administrative and general expenses represented 1.5% of Devices & Services net sales,
compared with 1.3% in 2010.
Other operating income and expenses were expense of EUR 773 million in 2011 and included
restructuring charges of 456 million, impairment of assets of EUR 90 million, Accenture deal
consideration related to the Accenture transaction of EUR 251 million, impairment of shares in an
associated company of EUR 41 million and a benefit from a cartel claim settlement of EUR 49 million.
In 2010, other operating income and expenses were EUR 170 million and included restructuring
charges of EUR 85 million, a prior year-related refund of customs duties of EUR 61 million, a gain on
sale of assets and business of EUR 29 million and a gain on sale of the wireless modem business of
EUR 147 million.
Cost Reduction Activities and Planned Operational Adjustments
We are targeting to reduce our Devices & Services operating expenses by more than EUR 1 billion for
the full year 2013, compared to Devices & Services operating expenses of EUR 5.35 billion for the full
year 2010, excluding special items and purchase price accounting related items. This reduction is
expected to come from a variety of different sources and initiatives, including a planned reduction in
the number of employees and normal personnel attrition, a reduction in the use of outsourced
professionals, reductions in facility costs, and various improvements in efficiencies. See “—Principal
Factors & Trends Affecting our Results of Operations—Devices & Services—Operational Efficiency
and Cost Control” in this Item 5 for a discussion of our restructuring actions.
119