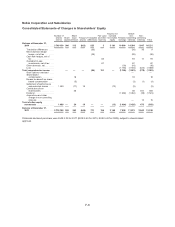
Nokia 2011 Annual Report Download - page 225
Download and view the complete annual report
Please find page 225 of the 2011 Nokia annual report below. You can navigate through the pages in the report by either clicking on the pages listed below, or by using the keyword search tool below to find specific information within the annual report.-
 1
1 -
2
-
3
-
4
-
5
-
6
-
7
-
8
-
9
-
10
-
11
-
12
-
13
-
14
-
15
-
16
-
17
-
18
-
19
-
20
-
21
-
22
-
23
-
24
-
25
-
26
-
27
-
28
-
29
-
30
-
31
-
32
-
33
-
34
-
35
-
36
-
37
-
38
-
39
-
40
-
41
-
42
-
43
-
44
-
45
-
46
-
47
-
48
-
49
-
50
-
51
-
52
-
53
-
54
-
55
-
56
-
57
-
58
-
59
-
60
-
61
-
62
-
63
-
64
-
65
-
66
-
67
-
68
-
69
-
70
-
71
-
72
-
73
-
74
-
75
-
76
-
77
-
78
-
79
-
80
-
81
-
82
-
83
-
84
-
85
-
86
-
87
-
88
-
89
-
90
-
91
-
92
-
93
-
94
-
95
-
96
-
97
-
98
-
99
-
100
-
101
-
102
-
103
-
104
-
105
-
106
-
107
-
108
-
109
-
110
-
111
-
112
-
113
-
114
-
115
-
116
-
117
-
118
-
119
-
120
-
121
-
122
-
123
-
124
-
125
-
126
-
127
-
128
-
129
-
130
-
131
-
132
-
133
-
134
-
135
-
136
-
137
-
138
-
139
-
140
-
141
-
142
-
143
-
144
-
145
-
146
-
147
-
148
-
149
-
150
-
151
-
152
-
153
-
154
-
155
-
156
-
157
-
158
-
159
-
160
-
161
-
162
-
163
-
164
-
165
-
166
-
167
-
168
-
169
-
170
-
171
-
172
-
173
-
174
-
175
-
176
-
177
-
178
-
179
-
180
-
181
-
182
-
183
-
184
-
185
-
186
-
187
-
188
-
189
-
190
-
191
-
192
-
193
-
194
-
195
-
196
-
197
-
198
-
199
-
200
-
201
-
202
-
203
-
204
-
205
-
206
-
207
-
208
-
209
-
210
-
211
-
212
-
213
-
214
-
 215
215 -
 216
216 -
 217
217 -
 218
218 -
 219
219 -
 220
220 -
 221
221 -
 222
222 -
 223
223 -
 224
224 -
 225
225 -
 226
226 -
 227
227 -
 228
228 -
 229
229 -
 230
230 -
 231
231 -
 232
232 -
 233
233 -
 234
234 -
 235
235 -
236
-
237
-
238
-
239
-
240
-
241
-
242
-
243
-
244
-
245
-
246
-
247
-
248
-
249
-
250
-
251
-
252
-
253
-
254
-
255
-
256
-
257
-
258
-
259
-
260
-
261
-
262
-
263
-
264
-
265
-
266
-
267
-
268
-
269
-
270
-
271
-
272
-
273
-
274
-
275
-
276
-
277
-
278
-
279
-
280
-
281
-
282
-
283
-
284
-
285
-
286
-
287
-
288
-
289
-
290
-
291
-
292
-
293
-
294
-
295
-
296
 |
 |
amounts of cash with maturities at acquisition of less than 3 months, which are classified in the
balance sheet as current available-for-sale investments, cash equivalents. Due to the high credit
quality and short-term nature of these investments, there is an insignificant risk of changes in value.
(2) Similar types of investments as in category (1), but with maturities at acquisition of longer than
3 months, are classified in the balance sheet as current available-for-sale investments, liquid assets.
(3) Investments in technology related publicly quoted equity shares, or unlisted private equity shares
and unlisted funds, are classified in the balance sheet as non-current available-for-sale investments.
Current fixed income and money-market investments are fair valued by using quoted market rates,
discounted cash flow analyses and other appropriate valuation models at the balance sheet date.
Investments in publicly quoted equity shares are measured at fair value using exchange quoted bid
prices. Other available-for-sale investments carried at fair value include holdings in unlisted shares.
Fair value is estimated by using various factors, including, but not limited to: (1) the current market
value of similar instruments, (2) prices established from a recent arm’s length financing transaction of
the target companies, (3) analysis of market prospects and operating performance of the target
companies taking into consideration the public market of comparable companies in similar industry
sectors. The remaining available-for-sale investments are carried at cost less impairment, which are
technology related investments in private equity shares and unlisted funds for which the fair value
cannot be measured reliably due to non-existence of public markets or reliable valuation methods
against which to value these assets. The investment and disposal decisions on these investments are
business driven.
All purchases and sales of investments are recorded on the trade date, which is the date that the
Group commits to purchase or sell the asset.
The changes in fair value of available-for-sale investments are recognized in fair value and other
reserves as part of shareholders’ equity, with the exception of interest calculated using the effective
interest method and foreign exchange gains and losses on monetary assets, which are recognized
directly in profit and loss. Dividends on available-for-sale equity instruments are recognized in profit
and loss when the Group’s right to receive payment is established. When the investment is disposed
of, the related accumulated changes in fair value are released from shareholders’ equity and
recognized in the income statement. The weighted average method is used when determining the cost-
basis of publicly listed equities being disposed of by the Group. FIFO (First-in First-out) method is used
to determine the cost basis of fixed income securities being disposed of by the Group. An impairment
is recorded when the carrying amount of an available-for-sale investment is greater than the estimated
fair value and there is objective evidence that the asset is impaired including, but not limited to,
counterparty default and other factors causing a reduction in value that can be considered other than
temporary. The cumulative net loss relating to that investment is removed from equity and recognized
in the income statement for the period. If, in a subsequent period, the fair value of the investment in a
non-equity instrument increases and the increase can be objectively related to an event occurring after
the loss was recognized, the loss is reversed, with the amount of the reversal included in the income
statement.
Investments at fair value through profit and loss, liquid assets
The investments at fair value through profit and loss, liquid assets include highly liquid financial assets
designated at fair value through profit or loss at inception. For investments designated at fair value
through profit or loss, the following criteria must be met: (1) the designation eliminates or significantly
reduces the inconsistent treatment that would otherwise arise from measuring the assets or
recognizing gains or losses on a different basis; or (2) the assets are part of a group of financial assets,
which are managed and their performance evaluated on a fair value basis, in accordance with a
documented risk management or investment strategy.
F-15