Nokia 2011 Annual Report Download - page 252
Download and view the complete annual report
Please find page 252 of the 2011 Nokia annual report below. You can navigate through the pages in the report by either clicking on the pages listed below, or by using the keyword search tool below to find specific information within the annual report.-
 1
1 -
2
-
3
-
4
-
5
-
6
-
7
-
8
-
9
-
10
-
11
-
12
-
13
-
14
-
15
-
16
-
17
-
18
-
19
-
20
-
21
-
22
-
23
-
24
-
25
-
26
-
27
-
28
-
29
-
30
-
31
-
32
-
33
-
34
-
35
-
36
-
37
-
38
-
39
-
40
-
41
-
42
-
43
-
44
-
45
-
46
-
47
-
48
-
49
-
50
-
51
-
52
-
53
-
54
-
55
-
56
-
57
-
58
-
59
-
60
-
61
-
62
-
63
-
64
-
65
-
66
-
67
-
68
-
69
-
70
-
71
-
72
-
73
-
74
-
75
-
76
-
77
-
78
-
79
-
80
-
81
-
82
-
83
-
84
-
85
-
86
-
87
-
88
-
89
-
90
-
91
-
92
-
93
-
94
-
95
-
96
-
97
-
98
-
99
-
100
-
101
-
102
-
103
-
104
-
105
-
106
-
107
-
108
-
109
-
110
-
111
-
112
-
113
-
114
-
115
-
116
-
117
-
118
-
119
-
120
-
121
-
122
-
123
-
124
-
125
-
126
-
127
-
128
-
129
-
130
-
131
-
132
-
133
-
134
-
135
-
136
-
137
-
138
-
139
-
140
-
141
-
142
-
143
-
144
-
145
-
146
-
147
-
148
-
149
-
150
-
151
-
152
-
153
-
154
-
155
-
156
-
157
-
158
-
159
-
160
-
161
-
162
-
163
-
164
-
165
-
166
-
167
-
168
-
169
-
170
-
171
-
172
-
173
-
174
-
175
-
176
-
177
-
178
-
179
-
180
-
181
-
182
-
183
-
184
-
185
-
186
-
187
-
188
-
189
-
190
-
191
-
192
-
193
-
194
-
195
-
196
-
197
-
198
-
199
-
200
-
201
-
202
-
203
-
204
-
205
-
206
-
207
-
208
-
209
-
210
-
211
-
212
-
213
-
214
-
215
-
216
-
217
-
218
-
219
-
220
-
221
-
222
-
223
-
224
-
225
-
226
-
227
-
228
-
229
-
230
-
231
-
232
-
233
-
234
-
235
-
236
-
237
-
238
-
239
-
240
-
241
-
 242
242 -
 243
243 -
 244
244 -
 245
245 -
 246
246 -
 247
247 -
 248
248 -
 249
249 -
 250
250 -
 251
251 -
 252
252 -
 253
253 -
 254
254 -
 255
255 -
 256
256 -
 257
257 -
 258
258 -
 259
259 -
 260
260 -
 261
261 -
 262
262 -
263
-
264
-
265
-
266
-
267
-
268
-
269
-
270
-
271
-
272
-
273
-
274
-
275
-
276
-
277
-
278
-
279
-
280
-
281
-
282
-
283
-
284
-
285
-
286
-
287
-
288
-
289
-
290
-
291
-
292
-
293
-
294
-
295
-
296
 |
 |

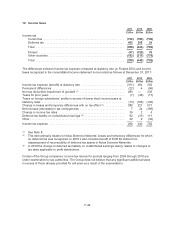
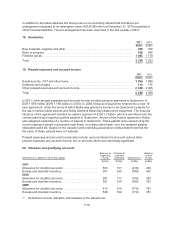
12. Income taxes
2011 2010 2009
EURm EURm EURm
Income tax
Current tax ..................................................... (752) (798) (736)
Deferred tax .................................................... 462 355 34
Total .......................................................... (290) (443) (702)
Finland ........................................................ (97) (126) 76
Other countries .................................................. (193) (317) (778)
Total .......................................................... (290) (443) (702)
The differences between income tax expense computed at statutory rate (in Finland 26%) and income
taxes recognized in the consolidated income statement is reconciled as follows at December 31, 2011:
2011 2010 2009
EURm EURm EURm
Income tax expense (benefit) at statutory rate ............................ (311) 464 250
Permanent differences ............................................... (22) 4 (96)
Non tax deductible impairment of goodwill (1) ............................. 283 — 236
Taxes for prior years ................................................. (7) (48) (17)
Taxes on foreign subsidiaries’ profits in excess of (lower than) income taxes at
statutory rates ...................................................... (73) (195) (145)
Change in losses and temporary differences with no tax effect (2) ............. 280 221 577
Net increase (decrease) in tax contingencies ............................. 7 24 (186)
Change in income tax rates ........................................... 39 2 4
Deferred tax liability on undistributed earnings (3) .......................... 62 (31) 111
Other .............................................................. 32 2 (32)
Income tax expense ................................................. 290 443 702
(1) See Note 8.
(2) This item primarily relates to Nokia Siemens Networks’ losses and temporary differences for which
no deferred tax was recognized. In 2010 it also includes benefit of EUR 52 million from
reassessment of recoverability of deferred tax assets in Nokia Siemens Networks.
(3) In 2010 the change in deferred tax liability on undistributed earnings mainly relates to changes to
tax rates applicable to profit distributions.
Certain of the Group companies’ income tax returns for periods ranging from 2004 through 2010 are
under examination by tax authorities. The Group does not believe that any significant additional taxes
in excess of those already provided for will arise as a result of the examinations.
F-42