Nokia 2011 Annual Report Download - page 257
Download and view the complete annual report
Please find page 257 of the 2011 Nokia annual report below. You can navigate through the pages in the report by either clicking on the pages listed below, or by using the keyword search tool below to find specific information within the annual report.-
 1
1 -
2
-
3
-
4
-
5
-
6
-
7
-
8
-
9
-
10
-
11
-
12
-
13
-
14
-
15
-
16
-
17
-
18
-
19
-
20
-
21
-
22
-
23
-
24
-
25
-
26
-
27
-
28
-
29
-
30
-
31
-
32
-
33
-
34
-
35
-
36
-
37
-
38
-
39
-
40
-
41
-
42
-
43
-
44
-
45
-
46
-
47
-
48
-
49
-
50
-
51
-
52
-
53
-
54
-
55
-
56
-
57
-
58
-
59
-
60
-
61
-
62
-
63
-
64
-
65
-
66
-
67
-
68
-
69
-
70
-
71
-
72
-
73
-
74
-
75
-
76
-
77
-
78
-
79
-
80
-
81
-
82
-
83
-
84
-
85
-
86
-
87
-
88
-
89
-
90
-
91
-
92
-
93
-
94
-
95
-
96
-
97
-
98
-
99
-
100
-
101
-
102
-
103
-
104
-
105
-
106
-
107
-
108
-
109
-
110
-
111
-
112
-
113
-
114
-
115
-
116
-
117
-
118
-
119
-
120
-
121
-
122
-
123
-
124
-
125
-
126
-
127
-
128
-
129
-
130
-
131
-
132
-
133
-
134
-
135
-
136
-
137
-
138
-
139
-
140
-
141
-
142
-
143
-
144
-
145
-
146
-
147
-
148
-
149
-
150
-
151
-
152
-
153
-
154
-
155
-
156
-
157
-
158
-
159
-
160
-
161
-
162
-
163
-
164
-
165
-
166
-
167
-
168
-
169
-
170
-
171
-
172
-
173
-
174
-
175
-
176
-
177
-
178
-
179
-
180
-
181
-
182
-
183
-
184
-
185
-
186
-
187
-
188
-
189
-
190
-
191
-
192
-
193
-
194
-
195
-
196
-
197
-
198
-
199
-
200
-
201
-
202
-
203
-
204
-
205
-
206
-
207
-
208
-
209
-
210
-
211
-
212
-
213
-
214
-
215
-
216
-
217
-
218
-
219
-
220
-
221
-
222
-
223
-
224
-
225
-
226
-
227
-
228
-
229
-
230
-
231
-
232
-
233
-
234
-
235
-
236
-
237
-
238
-
239
-
240
-
241
-
242
-
243
-
244
-
245
-
246
-
 247
247 -
 248
248 -
 249
249 -
 250
250 -
 251
251 -
 252
252 -
 253
253 -
 254
254 -
 255
255 -
 256
256 -
 257
257 -
 258
258 -
 259
259 -
 260
260 -
 261
261 -
 262
262 -
 263
263 -
 264
264 -
 265
265 -
 266
266 -
 267
267 -
268
-
269
-
270
-
271
-
272
-
273
-
274
-
275
-
276
-
277
-
278
-
279
-
280
-
281
-
282
-
283
-
284
-
285
-
286
-
287
-
288
-
289
-
290
-
291
-
292
-
293
-
294
-
295
-
296
 |
 |

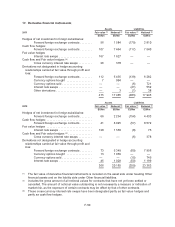
Carrying amounts
Total
carrying
amounts
Fair
value
At December 31, 2010
Current
available-for-
sale financial
assets
Non-current
available-for-
sale financial
assets
Financial
instruments
at fair value
through profit
or loss
Loans and
receivables
measured at
amortized
cost
Financial
liabilities
measured at
amortized
cost
EURm EURm EURm EURm EURm EURm EURm
Available-for-sale investments in
publicly quoted equity
shares ................... — 8 — — — 8 8
Other available-for-sale
investments carried at fair
value ..................... — 293 — — — 293 293
Other available-for-sale
investments carried at cost
less impairment ............ — 232 — — — 232 232
Long-term loans receivable .... — — — 64 — 64 60
Other non-current assets ...... — — — 4 — 4 4
Accounts receivable .......... — — — 7570 — 7570 7570
Current portion of long-term
loans receivable ........... — — — 39 — 39 39
Derivative assets ............. — — 366 — — 366 366
Other current financial assets . . — — — 12 — 12 12
Fixed income and money-
market investments carried at
fair value ................. 9413 — — — — 9413 9413
Investments designated at fair
value through profit and
loss ...................... — — 911 — — 911 911
Total financial assets ......... 9 413 533 1 277 7 689 — 18 912 18 908
Long-term interest-bearing
liabilities .................. — — — — 4242 4242 4467
Other long-term non-interest
bearing financial liabilities .... — — — — 13 13 13
Current portion of long-term
loans payable ............. — — — — 116 116 116
Short-term borrowings ........ — — — — 921 921 921
Other financial liabilities ....... — — 359 — 88 447 447
Accounts payable ............ — — — — 6101 6101 6101
Total financial liabilities ........ — — 359 — 11 481 11 840 12 065
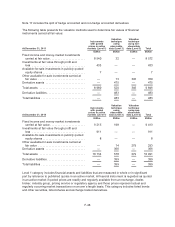
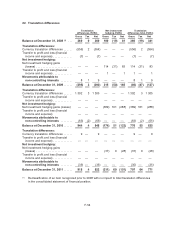
The current fixed income and money market investments included available for sale liquid assets of
EUR 1 233 million (EUR 3 772 million in 2010) and cash equivalents of EUR 7 279 million
(EUR 5 641 million in 2010). See Note 34, section Financial Credit Risk, for details on fixed income
and money-market investments.
For information about the valuation of items measured at fair value see Note 1.
In the tables above fair value is set to carrying amount for other available-for-sale investments carried
at cost less impairment for which no reliable fair value has been possible to estimate.
The fair value of loan receivables and payables is estimated based on the current market values of
similar instruments. Fair value is estimated to be equal to the carrying amount for short-term financial
assets and financial liabilities due to limited credit risk and short time to maturity.
The Group had a non-controlling interest that includes a put arrangement measured at its redemption
value of EUR 88 million at December 31, 2010 presented in Other financial liabilities. The put
arrangement has been exercised in the first quarter of 2011. The remaining portion of the line Other
financial liabilities is comprised of derivative liabilities.
F-47