Nokia 2011 Annual Report Download - page 284
Download and view the complete annual report
Please find page 284 of the 2011 Nokia annual report below. You can navigate through the pages in the report by either clicking on the pages listed below, or by using the keyword search tool below to find specific information within the annual report.-
 1
1 -
2
-
3
-
4
-
5
-
6
-
7
-
8
-
9
-
10
-
11
-
12
-
13
-
14
-
15
-
16
-
17
-
18
-
19
-
20
-
21
-
22
-
23
-
24
-
25
-
26
-
27
-
28
-
29
-
30
-
31
-
32
-
33
-
34
-
35
-
36
-
37
-
38
-
39
-
40
-
41
-
42
-
43
-
44
-
45
-
46
-
47
-
48
-
49
-
50
-
51
-
52
-
53
-
54
-
55
-
56
-
57
-
58
-
59
-
60
-
61
-
62
-
63
-
64
-
65
-
66
-
67
-
68
-
69
-
70
-
71
-
72
-
73
-
74
-
75
-
76
-
77
-
78
-
79
-
80
-
81
-
82
-
83
-
84
-
85
-
86
-
87
-
88
-
89
-
90
-
91
-
92
-
93
-
94
-
95
-
96
-
97
-
98
-
99
-
100
-
101
-
102
-
103
-
104
-
105
-
106
-
107
-
108
-
109
-
110
-
111
-
112
-
113
-
114
-
115
-
116
-
117
-
118
-
119
-
120
-
121
-
122
-
123
-
124
-
125
-
126
-
127
-
128
-
129
-
130
-
131
-
132
-
133
-
134
-
135
-
136
-
137
-
138
-
139
-
140
-
141
-
142
-
143
-
144
-
145
-
146
-
147
-
148
-
149
-
150
-
151
-
152
-
153
-
154
-
155
-
156
-
157
-
158
-
159
-
160
-
161
-
162
-
163
-
164
-
165
-
166
-
167
-
168
-
169
-
170
-
171
-
172
-
173
-
174
-
175
-
176
-
177
-
178
-
179
-
180
-
181
-
182
-
183
-
184
-
185
-
186
-
187
-
188
-
189
-
190
-
191
-
192
-
193
-
194
-
195
-
196
-
197
-
198
-
199
-
200
-
201
-
202
-
203
-
204
-
205
-
206
-
207
-
208
-
209
-
210
-
211
-
212
-
213
-
214
-
215
-
216
-
217
-
218
-
219
-
220
-
221
-
222
-
223
-
224
-
225
-
226
-
227
-
228
-
229
-
230
-
231
-
232
-
233
-
234
-
235
-
236
-
237
-
238
-
239
-
240
-
241
-
242
-
243
-
244
-
245
-
246
-
247
-
248
-
249
-
250
-
251
-
252
-
253
-
254
-
255
-
256
-
257
-
258
-
259
-
260
-
261
-
262
-
263
-
264
-
265
-
266
-
267
-
268
-
269
-
270
-
271
-
272
-
273
-
 274
274 -
 275
275 -
 276
276 -
 277
277 -
 278
278 -
 279
279 -
 280
280 -
 281
281 -
 282
282 -
 283
283 -
 284
284 -
 285
285 -
 286
286 -
 287
287 -
 288
288 -
 289
289 -
 290
290 -
 291
291 -
 292
292 -
 293
293 -
 294
294 -
295
-
296
 |
 |

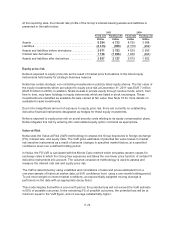
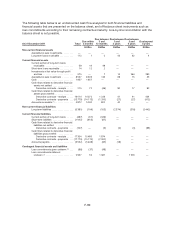
At the reporting date, the interest rate profile of the Group’s interest-bearing assets and liabilities is
presented in the table below:
2011 2010
Fixed rate Floating rate Fixed rate Floating rate
EURm EURm EURm EURm
Assets ........................................ 6 384 4 733 8 795 3 588
Liabilities ...................................... (4 313) (950) (4 156) (992)
Assets and liabilities before derivatives ............. 2 071 3 783 4 639 2 596
Interest rate derivatives .......................... 1 736 (1 656) 1 036 (994)
Assets and liabilities after derivatives ............... 3 807 2 127 5 675 1 602
Equity price risk
Nokia is exposed to equity price risk as the result of market price fluctuations in the listed equity
instruments held mainly for strategic business reasons.
Nokia has certain strategic non-controlling investments in publicly listed equity shares. The fair value of
the equity investments which are subject to equity price risk at December 31, 2011 was EUR 7 million
(EUR 8 million in 2010). In addition, Nokia invests in private equity through venture funds, which, from
time to time, may have holdings in equity instruments which are listed in stock exchanges. These
investments are classified as available-for-sale carried at fair value. See Note 16 for more details on
available-for-sale investments.
Due to the insignificant amount of exposure to equity price risk, there are currently no outstanding
derivative financial instruments designated as hedges for these equity investments.
Nokia is exposed to equity price risk on social security costs relating to its equity compensation plans.
Nokia mitigates this risk by entering into cash settled equity option contracts as appropriate.
Value-at-Risk
Nokia uses the Value-at-Risk (VaR) methodology to assess the Group exposures to foreign exchange
(FX), interest rate, and equity risks. The VaR gives estimates of potential fair value losses in market
risk sensitive instruments as a result of adverse changes in specified market factors, at a specified
confidence level over a defined holding period.
In Nokia, the FX VaR is calculated with the Monte Carlo method which simulates random values for
exchange rates in which the Group has exposures and takes the non-linear price function of certain FX
derivative instruments into account. The variance-covariance methodology is used to assess and
measure the interest rate risk and equity price risk.
The VaR is determined by using volatilities and correlations of rates and prices estimated from a
one-year sample of historical market data, at 95% confidence level, using a one-month holding period.
To put more weight on recent market conditions, an exponentially weighted moving average is
performed on the data with an appropriate decay factor.
This model implies that within a one-month period, the potential loss will not exceed the VaR estimate
in 95% of possible outcomes. In the remaining 5% of possible outcomes, the potential loss will be at
minimum equal to the VaR figure, and on average substantially higher.
F-74