Nokia 2011 Annual Report Download - page 120
Download and view the complete annual report
Please find page 120 of the 2011 Nokia annual report below. You can navigate through the pages in the report by either clicking on the pages listed below, or by using the keyword search tool below to find specific information within the annual report.-
 1
1 -
2
-
3
-
4
-
5
-
6
-
7
-
8
-
9
-
10
-
11
-
12
-
13
-
14
-
15
-
16
-
17
-
18
-
19
-
20
-
21
-
22
-
23
-
24
-
25
-
26
-
27
-
28
-
29
-
30
-
31
-
32
-
33
-
34
-
35
-
36
-
37
-
38
-
39
-
40
-
41
-
42
-
43
-
44
-
45
-
46
-
47
-
48
-
49
-
50
-
51
-
52
-
53
-
54
-
55
-
56
-
57
-
58
-
59
-
60
-
61
-
62
-
63
-
64
-
65
-
66
-
67
-
68
-
69
-
70
-
71
-
72
-
73
-
74
-
75
-
76
-
77
-
78
-
79
-
80
-
81
-
82
-
83
-
84
-
85
-
86
-
87
-
88
-
89
-
90
-
91
-
92
-
93
-
94
-
95
-
96
-
97
-
98
-
99
-
100
-
101
-
102
-
103
-
104
-
105
-
106
-
107
-
108
-
109
-
 110
110 -
 111
111 -
 112
112 -
 113
113 -
 114
114 -
 115
115 -
 116
116 -
 117
117 -
 118
118 -
 119
119 -
 120
120 -
 121
121 -
 122
122 -
 123
123 -
 124
124 -
 125
125 -
 126
126 -
 127
127 -
 128
128 -
 129
129 -
 130
130 -
131
-
132
-
133
-
134
-
135
-
136
-
137
-
138
-
139
-
140
-
141
-
142
-
143
-
144
-
145
-
146
-
147
-
148
-
149
-
150
-
151
-
152
-
153
-
154
-
155
-
156
-
157
-
158
-
159
-
160
-
161
-
162
-
163
-
164
-
165
-
166
-
167
-
168
-
169
-
170
-
171
-
172
-
173
-
174
-
175
-
176
-
177
-
178
-
179
-
180
-
181
-
182
-
183
-
184
-
185
-
186
-
187
-
188
-
189
-
190
-
191
-
192
-
193
-
194
-
195
-
196
-
197
-
198
-
199
-
200
-
201
-
202
-
203
-
204
-
205
-
206
-
207
-
208
-
209
-
210
-
211
-
212
-
213
-
214
-
215
-
216
-
217
-
218
-
219
-
220
-
221
-
222
-
223
-
224
-
225
-
226
-
227
-
228
-
229
-
230
-
231
-
232
-
233
-
234
-
235
-
236
-
237
-
238
-
239
-
240
-
241
-
242
-
243
-
244
-
245
-
246
-
247
-
248
-
249
-
250
-
251
-
252
-
253
-
254
-
255
-
256
-
257
-
258
-
259
-
260
-
261
-
262
-
263
-
264
-
265
-
266
-
267
-
268
-
269
-
270
-
271
-
272
-
273
-
274
-
275
-
276
-
277
-
278
-
279
-
280
-
281
-
282
-
283
-
284
-
285
-
286
-
287
-
288
-
289
-
290
-
291
-
292
-
293
-
294
-
295
-
296
 |
 |

The 18% year-on-year decline in Devices & Services net sales in 2011 resulted from lower volumes
and ASPs in both Smart Devices and Mobile Phones discussed below, partially offset by higher IPR
royalty income discussed below.
During the second quarter of 2011, Devices & Services net sales were negatively affected by unexpected
sales and inventory patterns, resulting in distributors and operators purchasing fewer of our devices
across our portfolio as they reduced their inventories of Nokia devices. Devices & Services net sales
were also affected during the second quarter of 2011 by a negative mix shift towards devices with lower
average selling prices and lower gross margins. Our actions enabled us to create healthier sales channel
dynamics during the latter weeks of the second quarter 2011. Devices & Services net sales increased
sequentially in the fourth quarter 2011, supported by broader product renewal in both Mobile Phones, for
example dual SIM devices, and Smart Devices as well as overall industry seasonality.
Our overall Devices & Services net sales in 2011 benefited from the recognition in Devices & Services
Other of approximately EUR 450 million (approximately EUR 70 million in 2010) of non-recurring IPR
royalty income, as well as strong growth in the underlying recurring IPR royalty income. We believe
these developments underline Nokia’s industry leading patent portfolio. During the last two decades,
we have invested more than EUR 45 billion in research and development and built one of the wireless
industry’s strongest and broadest IPR portfolios, with over 10 000 patent families. Nokia is a world
leader in the development of mobile device and mobile communications technologies, which is also
demonstrated by our strong patent position.
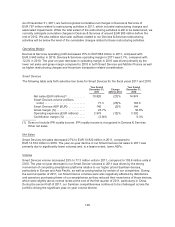
Volume
The following chart sets out the mobile device volumes for our Devices & Services business and year–
on-year growth rates by geographic area for the fiscal years 2011 and 2010. The IPR royalty income
referred to in the paragraph above has been allocated to the geographic area contained in this chart.
Year Ended
December 31,
2011
Change
2010 to 2011
Year Ended
December 31,
2010
(Units in millions, except percentage data)
Europe ........................... 87.8 (22)% 112.7
Middle East & Africa ................ 94.6 13% 83.8
Greater China ...................... 65.8 (20)% 82.5
Asia-Pacific ........................ 118.9 0% 119.1
North America ..................... 3.9 (65)% 11.1
Latin America ...................... 46.1 5% 43.7
Total ............................. 417.1 (8)% 452.9
On a year-on-year basis, the decline in our total Devices & Services volumes in 2011 was driven by
lower volumes in both Smart Devices and Mobile Phones discussed below.
Average Selling Price
Our mobile device ASP in 2011 was EUR 57, down 11% from EUR 64 in 2010. The decrease in our
Devices & Services ASP in 2011 was driven primarily by the increase in the proportion of Mobile
Phone sales partially offset by the positive effect of higher IPR royalty income and the lower deferral of
revenue related to services sold in combination with our devices. On a year-on-year basis, the impact
from the appreciation of the euro against certain currencies had a slightly negative impact, almost
entirely offset by the positive impact from foreign currency hedging.
118