Nokia 2011 Annual Report Download - page 142
Download and view the complete annual report
Please find page 142 of the 2011 Nokia annual report below. You can navigate through the pages in the report by either clicking on the pages listed below, or by using the keyword search tool below to find specific information within the annual report.-
 1
1 -
2
-
3
-
4
-
5
-
6
-
7
-
8
-
9
-
10
-
11
-
12
-
13
-
14
-
15
-
16
-
17
-
18
-
19
-
20
-
21
-
22
-
23
-
24
-
25
-
26
-
27
-
28
-
29
-
30
-
31
-
32
-
33
-
34
-
35
-
36
-
37
-
38
-
39
-
40
-
41
-
42
-
43
-
44
-
45
-
46
-
47
-
48
-
49
-
50
-
51
-
52
-
53
-
54
-
55
-
56
-
57
-
58
-
59
-
60
-
61
-
62
-
63
-
64
-
65
-
66
-
67
-
68
-
69
-
70
-
71
-
72
-
73
-
74
-
75
-
76
-
77
-
78
-
79
-
80
-
81
-
82
-
83
-
84
-
85
-
86
-
87
-
88
-
89
-
90
-
91
-
92
-
93
-
94
-
95
-
96
-
97
-
98
-
99
-
100
-
101
-
102
-
103
-
104
-
105
-
106
-
107
-
108
-
109
-
110
-
111
-
112
-
113
-
114
-
115
-
116
-
117
-
118
-
119
-
120
-
121
-
122
-
123
-
124
-
125
-
126
-
127
-
128
-
129
-
130
-
131
-
 132
132 -
 133
133 -
 134
134 -
 135
135 -
 136
136 -
 137
137 -
 138
138 -
 139
139 -
 140
140 -
 141
141 -
 142
142 -
 143
143 -
 144
144 -
 145
145 -
 146
146 -
 147
147 -
 148
148 -
 149
149 -
 150
150 -
 151
151 -
 152
152 -
153
-
154
-
155
-
156
-
157
-
158
-
159
-
160
-
161
-
162
-
163
-
164
-
165
-
166
-
167
-
168
-
169
-
170
-
171
-
172
-
173
-
174
-
175
-
176
-
177
-
178
-
179
-
180
-
181
-
182
-
183
-
184
-
185
-
186
-
187
-
188
-
189
-
190
-
191
-
192
-
193
-
194
-
195
-
196
-
197
-
198
-
199
-
200
-
201
-
202
-
203
-
204
-
205
-
206
-
207
-
208
-
209
-
210
-
211
-
212
-
213
-
214
-
215
-
216
-
217
-
218
-
219
-
220
-
221
-
222
-
223
-
224
-
225
-
226
-
227
-
228
-
229
-
230
-
231
-
232
-
233
-
234
-
235
-
236
-
237
-
238
-
239
-
240
-
241
-
242
-
243
-
244
-
245
-
246
-
247
-
248
-
249
-
250
-
251
-
252
-
253
-
254
-
255
-
256
-
257
-
258
-
259
-
260
-
261
-
262
-
263
-
264
-
265
-
266
-
267
-
268
-
269
-
270
-
271
-
272
-
273
-
274
-
275
-
276
-
277
-
278
-
279
-
280
-
281
-
282
-
283
-
284
-
285
-
286
-
287
-
288
-
289
-
290
-
291
-
292
-
293
-
294
-
295
-
296
 |
 |

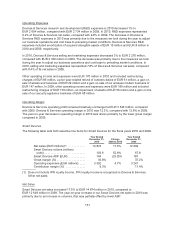
In 2010, our total structured financing, outstanding and committed, increased to EUR 188 million from
EUR 159 million in 2009 and primarily consisted of outstanding long-term loans to network operators.
See Note 34(b) to our consolidated financial statements included in Item 18 of this annual report for
further information relating to our committed and outstanding customer financing.
We continue to make arrangements with financial institutions and investors to sell credit risk we have
incurred from the commitments and outstanding loans we have made as well as from the financial
guarantees we may have given. Should the demand for customer finance increase in the future, we
intend to further mitigate our total structured financing exposure, market conditions permitting.
We expect our structured financing commitments to be financed mainly through the capital markets as
well as through cash flow from operations.
The structured financing commitments are available under loan facilities mainly negotiated with
customers of Nokia Siemens Networks. Availability of the amounts is dependent upon the borrowers’
continuing compliance with stated financial and operational covenants and compliance with other
administrative terms of the facilities. The customer loans are available to fund capital expenditure
relating to the purchase of network infrastructure equipment and services from Nokia Siemens
Networks.
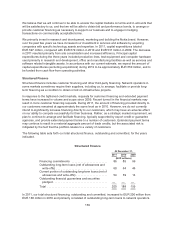
The following table sets forth the amounts of our contingent commitments for the periods indicated as
at December 31, 2011. The amounts represent the maximum principal amount of commitments.
Contingent Commitments Expiration Per Period
2012 2013-2014 2015-2016 Thereafter Total
(EUR millions)
Guarantees of Nokia’s performance .................. 663 152 48 134 997
Guarantees of Nokia’s performance consist of EUR 997 million of guarantees that are provided to
certain Nokia Siemens Networks customers in the form of bank guarantees, or corporate guarantees
issued by Nokia Siemens Networks’ Group entity. These instruments entitle the customer to claim
payment as compensation for non-performance by Nokia Siemens Networks of its obligations under
network infrastructure supply agreements. Depending on the nature of the instrument, compensation is
payable either on demand, or subject to verification of non-performance.
Financial guarantees and securities pledged we may give on behalf of customers represent guarantees
relating to payment by certain Nokia Siemens Networks’ customers and other third parties under
specified loan facilities between such a customer or other third parties and their creditors. Nokia’s
obligations under such guarantees are released upon the earlier of expiration of the guarantee or early
payment by the customer or other third party.
See Note 29 to our consolidated financial statements included in Item 18 of this annual report for
further information regarding commitments and contingencies.
5C. Research and Development, Patents and Licenses
Success in the mobile communications industry requires continuous introduction of new products and
services and their combinations based on the latest available technology. Consequently, we have
made substantial research and development (“R&D”) investments in each of the last three years. Our
140