Nokia 2011 Annual Report Download - page 239
Download and view the complete annual report
Please find page 239 of the 2011 Nokia annual report below. You can navigate through the pages in the report by either clicking on the pages listed below, or by using the keyword search tool below to find specific information within the annual report.-
 1
1 -
2
-
3
-
4
-
5
-
6
-
7
-
8
-
9
-
10
-
11
-
12
-
13
-
14
-
15
-
16
-
17
-
18
-
19
-
20
-
21
-
22
-
23
-
24
-
25
-
26
-
27
-
28
-
29
-
30
-
31
-
32
-
33
-
34
-
35
-
36
-
37
-
38
-
39
-
40
-
41
-
42
-
43
-
44
-
45
-
46
-
47
-
48
-
49
-
50
-
51
-
52
-
53
-
54
-
55
-
56
-
57
-
58
-
59
-
60
-
61
-
62
-
63
-
64
-
65
-
66
-
67
-
68
-
69
-
70
-
71
-
72
-
73
-
74
-
75
-
76
-
77
-
78
-
79
-
80
-
81
-
82
-
83
-
84
-
85
-
86
-
87
-
88
-
89
-
90
-
91
-
92
-
93
-
94
-
95
-
96
-
97
-
98
-
99
-
100
-
101
-
102
-
103
-
104
-
105
-
106
-
107
-
108
-
109
-
110
-
111
-
112
-
113
-
114
-
115
-
116
-
117
-
118
-
119
-
120
-
121
-
122
-
123
-
124
-
125
-
126
-
127
-
128
-
129
-
130
-
131
-
132
-
133
-
134
-
135
-
136
-
137
-
138
-
139
-
140
-
141
-
142
-
143
-
144
-
145
-
146
-
147
-
148
-
149
-
150
-
151
-
152
-
153
-
154
-
155
-
156
-
157
-
158
-
159
-
160
-
161
-
162
-
163
-
164
-
165
-
166
-
167
-
168
-
169
-
170
-
171
-
172
-
173
-
174
-
175
-
176
-
177
-
178
-
179
-
180
-
181
-
182
-
183
-
184
-
185
-
186
-
187
-
188
-
189
-
190
-
191
-
192
-
193
-
194
-
195
-
196
-
197
-
198
-
199
-
200
-
201
-
202
-
203
-
204
-
205
-
206
-
207
-
208
-
209
-
210
-
211
-
212
-
213
-
214
-
215
-
216
-
217
-
218
-
219
-
220
-
221
-
222
-
223
-
224
-
225
-
226
-
227
-
228
-
 229
229 -
 230
230 -
 231
231 -
 232
232 -
 233
233 -
 234
234 -
 235
235 -
 236
236 -
 237
237 -
 238
238 -
 239
239 -
 240
240 -
 241
241 -
 242
242 -
 243
243 -
 244
244 -
 245
245 -
 246
246 -
 247
247 -
 248
248 -
 249
249 -
250
-
251
-
252
-
253
-
254
-
255
-
256
-
257
-
258
-
259
-
260
-
261
-
262
-
263
-
264
-
265
-
266
-
267
-
268
-
269
-
270
-
271
-
272
-
273
-
274
-
275
-
276
-
277
-
278
-
279
-
280
-
281
-
282
-
283
-
284
-
285
-
286
-
287
-
288
-
289
-
290
-
291
-
292
-
293
-
294
-
295
-
296
 |
 |

Networks’ liabilities include non-current liabilities and short-term borrowings as well as interest and tax related
prepaid income and accrued expenses and provisions. These are directly attributable to Location & Commerce and
Nokia Siemens Networks.
(6) Unallocated liabilities include non-current liabilities and short-term borrowings as well as interest and tax related
prepaid income, accrued expenses and provisions related to Devices & Services and Corporate Common Functions.
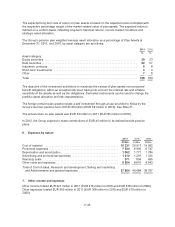
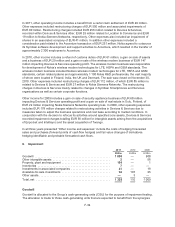
Net sales to external customers by geographic area by location of customer 2011 2010 2009
EURm EURm EURm
Finland ........................................................................ 317 371 390
China ......................................................................... 6130 7149 5990
India .......................................................................... 2923 2952 2809
Brazil ......................................................................... 1901 1506 1333
Russia ........................................................................ 1843 1744 1528
Germany ...................................................................... 1606 2019 1733
Japan ......................................................................... 1539 730 312
USA .......................................................................... 1405 1630 1731
UK ........................................................................... 996 1470 1916
Italy .......................................................................... 982 1266 1252
Other ......................................................................... 19017 21609 21990
Total .......................................................................... 38659 42446 40984
Segment non-current assets by geographic area(7) 2011 2010
EURm EURm
Finland ........................................................................ 894 1501
China ......................................................................... 472 402
India .......................................................................... 185 210
Germany ...................................................................... 192 209
UK ........................................................................... 120 236
USA .......................................................................... 4732 6079
Other ......................................................................... 1497 1008
Total .......................................................................... 8092 9645
(7) Comprises intangible and tangible assets and property, plant and equipment
3. Percentage of completion
Contract sales recognized under percentage of completion accounting are EUR 4 769 million in 2011
(EUR 5 094 million in 2010 and EUR 6 868 million in 2009). Services revenue for managed services
and network maintenance contracts are EUR 2 994 million in 2011 (EUR 2 924 million in 2010 and
EUR 2 607 million in 2009).
Advances received related to construction contracts, included in accrued expenses and other liabilities,
are EUR 95 million at December 31, 2011 (EUR 161 million in 2010). Included in accounts receivable
are contract revenues recorded prior to billings EUR 1 267 million at December 31, 2011
(EUR 1 326 million in 2010) and billings in excess of costs incurred are EUR 260 million at
December 31, 2011 (EUR 510 million in 2010).
The aggregate amount of costs incurred and recognized profits (net of recognized losses) under
construction contracts in progress since inception is EUR 20 077 million at December 31, 2011
(EUR 17 262 million in 2010).
Retentions related to construction contracts, included in accounts receivable, are EUR 136 million at
December 31, 2011 (EUR 207 million at December 31, 2010).
F-29