Nokia 2011 Annual Report Download - page 246
Download and view the complete annual report
Please find page 246 of the 2011 Nokia annual report below. You can navigate through the pages in the report by either clicking on the pages listed below, or by using the keyword search tool below to find specific information within the annual report.-
 1
1 -
2
-
3
-
4
-
5
-
6
-
7
-
8
-
9
-
10
-
11
-
12
-
13
-
14
-
15
-
16
-
17
-
18
-
19
-
20
-
21
-
22
-
23
-
24
-
25
-
26
-
27
-
28
-
29
-
30
-
31
-
32
-
33
-
34
-
35
-
36
-
37
-
38
-
39
-
40
-
41
-
42
-
43
-
44
-
45
-
46
-
47
-
48
-
49
-
50
-
51
-
52
-
53
-
54
-
55
-
56
-
57
-
58
-
59
-
60
-
61
-
62
-
63
-
64
-
65
-
66
-
67
-
68
-
69
-
70
-
71
-
72
-
73
-
74
-
75
-
76
-
77
-
78
-
79
-
80
-
81
-
82
-
83
-
84
-
85
-
86
-
87
-
88
-
89
-
90
-
91
-
92
-
93
-
94
-
95
-
96
-
97
-
98
-
99
-
100
-
101
-
102
-
103
-
104
-
105
-
106
-
107
-
108
-
109
-
110
-
111
-
112
-
113
-
114
-
115
-
116
-
117
-
118
-
119
-
120
-
121
-
122
-
123
-
124
-
125
-
126
-
127
-
128
-
129
-
130
-
131
-
132
-
133
-
134
-
135
-
136
-
137
-
138
-
139
-
140
-
141
-
142
-
143
-
144
-
145
-
146
-
147
-
148
-
149
-
150
-
151
-
152
-
153
-
154
-
155
-
156
-
157
-
158
-
159
-
160
-
161
-
162
-
163
-
164
-
165
-
166
-
167
-
168
-
169
-
170
-
171
-
172
-
173
-
174
-
175
-
176
-
177
-
178
-
179
-
180
-
181
-
182
-
183
-
184
-
185
-
186
-
187
-
188
-
189
-
190
-
191
-
192
-
193
-
194
-
195
-
196
-
197
-
198
-
199
-
200
-
201
-
202
-
203
-
204
-
205
-
206
-
207
-
208
-
209
-
210
-
211
-
212
-
213
-
214
-
215
-
216
-
217
-
218
-
219
-
220
-
221
-
222
-
223
-
224
-
225
-
226
-
227
-
228
-
229
-
230
-
231
-
232
-
233
-
234
-
235
-
 236
236 -
 237
237 -
 238
238 -
 239
239 -
 240
240 -
 241
241 -
 242
242 -
 243
243 -
 244
244 -
 245
245 -
 246
246 -
 247
247 -
 248
248 -
 249
249 -
 250
250 -
 251
251 -
 252
252 -
 253
253 -
 254
254 -
 255
255 -
 256
256 -
257
-
258
-
259
-
260
-
261
-
262
-
263
-
264
-
265
-
266
-
267
-
268
-
269
-
270
-
271
-
272
-
273
-
274
-
275
-
276
-
277
-
278
-
279
-
280
-
281
-
282
-
283
-
284
-
285
-
286
-
287
-
288
-
289
-
290
-
291
-
292
-
293
-
294
-
295
-
296
 |
 |

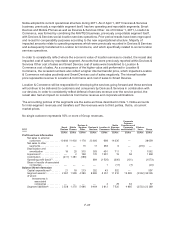
into consideration the market dynamics in digital map data and related location-based content markets,
including the Group’s long-term view that the market will move from fee-based models towards
advertising-based models especially in some more mature markets. It also reflects recently announced
results and related competitive factors in local search and advertising markets resulting in lower
estimated growth prospects from location-based assets integrated with different advertising platforms.
After consideration of all relevant factors, the Group reduced the net sales projections for the
Location & Commerce CGU which, in turn, reduced projected profitability and cash flows.
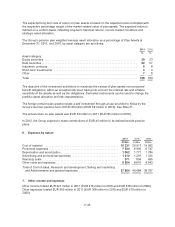
The Group has concluded that the recoverable amount for the Location & Commerce CGU is most
sensitive to the valuation assumptions for discount rate and long-term growth rate. A reasonably
possible increase in the discount rate or decrease in long-term growth rate would give rise to an
additional material impairment loss.
The key assumptions applied in the impairment testing analysis for each CGU are presented in the
table below:
Cash-generating unit
Smart
Devices
Mobile
Phones
Location &
Commerce
Nokia Siemens
Networks
%% % %
Terminal growth rate ............................... 1.9 1.5 3.1 1.0
Post-tax discount rate .............................. 9.0 9.0 9.7 10.4
Pre-tax discount rate ............................... 12.2 13.1 13.1 13.8
Both value in use of Smart Devices CGU and Mobile Phones CGU and fair value less costs to sell for
Location & Commerce CGU and Nokia Siemens Networks CGU are determined on a pre-tax value
basis using pre-tax valuation assumptions including pre-tax cash flows and pre-tax discount rate. As
market-based rates of return for the Group’s CGUs are available only on a post-tax basis, the pre-tax
discount rates are derived by adjusting the post-tax discount rates to reflect the specific amount and
timing of future tax cash flows.
The discount rates applied in the impairment testing for each CGU have been determined
independently of capital structure reflecting current assessments of the time value of money and
relevant market risk premiums. Risk premiums included in the determination of the discount rate reflect
risks and uncertainties for which the future cash flow estimates have not been adjusted.
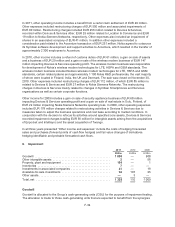
In 2009, the Group recorded an impairment loss of EUR 908 million to reduce the carrying amount of
the Nokia Siemens Networks CGU to its recoverable amount. The impairment loss was allocated in its
entirety to the carrying amount of goodwill arising from the formation of Nokia Siemens Networks and
from subsequent acquisitions completed by Nokia Siemens Networks. As a result of the impairment
loss, the amount of goodwill allocated to the Nokia Siemens Networks CGU in the year ended
December 31, 2009, was reduced to zero. Goodwill allocated to the Nokia Siemens Networks CGU
has subsequently increased during 2011, primarily as a result of the acquisition of Motorola Solutions’
Networks business (see Note 9).
The goodwill impairment testing conducted for each of the Group’s CGUs for the year ended
December 31, 2010 did not result in any impairment charges.
Other intangible assets
In conjunction with the Group’s decision to refocus its activities around specified core assets, the
Group recorded impairment charges in 2009 totaling EUR 56 million for intangible assets arising from
F-36