Nokia 2011 Annual Report Download - page 135
Download and view the complete annual report
Please find page 135 of the 2011 Nokia annual report below. You can navigate through the pages in the report by either clicking on the pages listed below, or by using the keyword search tool below to find specific information within the annual report.-
 1
1 -
2
-
3
-
4
-
5
-
6
-
7
-
8
-
9
-
10
-
11
-
12
-
13
-
14
-
15
-
16
-
17
-
18
-
19
-
20
-
21
-
22
-
23
-
24
-
25
-
26
-
27
-
28
-
29
-
30
-
31
-
32
-
33
-
34
-
35
-
36
-
37
-
38
-
39
-
40
-
41
-
42
-
43
-
44
-
45
-
46
-
47
-
48
-
49
-
50
-
51
-
52
-
53
-
54
-
55
-
56
-
57
-
58
-
59
-
60
-
61
-
62
-
63
-
64
-
65
-
66
-
67
-
68
-
69
-
70
-
71
-
72
-
73
-
74
-
75
-
76
-
77
-
78
-
79
-
80
-
81
-
82
-
83
-
84
-
85
-
86
-
87
-
88
-
89
-
90
-
91
-
92
-
93
-
94
-
95
-
96
-
97
-
98
-
99
-
100
-
101
-
102
-
103
-
104
-
105
-
106
-
107
-
108
-
109
-
110
-
111
-
112
-
113
-
114
-
115
-
116
-
117
-
118
-
119
-
120
-
121
-
122
-
123
-
124
-
 125
125 -
 126
126 -
 127
127 -
 128
128 -
 129
129 -
 130
130 -
 131
131 -
 132
132 -
 133
133 -
 134
134 -
 135
135 -
 136
136 -
 137
137 -
 138
138 -
 139
139 -
 140
140 -
 141
141 -
 142
142 -
 143
143 -
 144
144 -
 145
145 -
146
-
147
-
148
-
149
-
150
-
151
-
152
-
153
-
154
-
155
-
156
-
157
-
158
-
159
-
160
-
161
-
162
-
163
-
164
-
165
-
166
-
167
-
168
-
169
-
170
-
171
-
172
-
173
-
174
-
175
-
176
-
177
-
178
-
179
-
180
-
181
-
182
-
183
-
184
-
185
-
186
-
187
-
188
-
189
-
190
-
191
-
192
-
193
-
194
-
195
-
196
-
197
-
198
-
199
-
200
-
201
-
202
-
203
-
204
-
205
-
206
-
207
-
208
-
209
-
210
-
211
-
212
-
213
-
214
-
215
-
216
-
217
-
218
-
219
-
220
-
221
-
222
-
223
-
224
-
225
-
226
-
227
-
228
-
229
-
230
-
231
-
232
-
233
-
234
-
235
-
236
-
237
-
238
-
239
-
240
-
241
-
242
-
243
-
244
-
245
-
246
-
247
-
248
-
249
-
250
-
251
-
252
-
253
-
254
-
255
-
256
-
257
-
258
-
259
-
260
-
261
-
262
-
263
-
264
-
265
-
266
-
267
-
268
-
269
-
270
-
271
-
272
-
273
-
274
-
275
-
276
-
277
-
278
-
279
-
280
-
281
-
282
-
283
-
284
-
285
-
286
-
287
-
288
-
289
-
290
-
291
-
292
-
293
-
294
-
295
-
296
 |
 |

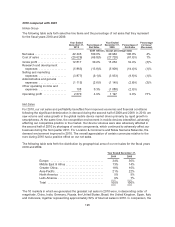
Gross Margin
Mobile Phones gross margin was 28.0% in 2010, down from 28.5% in 2009. The year-on-year decline
in our Mobile Phones gross margin in 2011 was due primarily to general price pressure and product
material cost erosion being less than general product price erosion.
Location & Commerce
The following table sets forth selective line items and the percentage of net sales that they represent
for Location & Commerce for the fiscal years 2010 and 2009.
Year Ended
December 31,
2010
Percentage of
Net Sales
Year Ended
December 31,
2009
Percentage of
Net Sales
(EUR millions, except percentage data)
Net sales ............................... 869 100.0% 756 100.0%
Cost of sales ............................ (169) (19.4)% (131) (17.3)%
Gross profit ............................. 700 80.6% 625 82.7%
Research and development expenses ....... (1011) (116.3)% (902) (119.3)%
Selling and marketing expenses ............ (274) (31.5)% (253) (33.5)%
Administrative and general expenses ....... (75) (8.6)% (66) (8.7)%
Other operating income and expenses ...... (3) (0.3)% 1
Operating profit ......................... (663) (76.3)% (594) (78.6)%
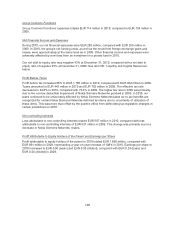
Net Sales
The following table sets forth Location & Commerce net sales and year-on-year growth rate by
geographic area for the fiscal years 2010 and 2009.
Year Ended
December 31,
2010
Change
2009 to 2010
Year Ended
December 31,
2009
(EUR millions, except percentage data)
Europe ........................... 380 8% 352
Middle East & Africa ................ 44 33% 33
Greater China ...................... 57 850% 6
Asia-Pacific ........................ 50 150% 20
North America ..................... 322 3% 331
Latin America ...................... 16 14% 14
Total ............................. 869 15% 756
Net sales of Location & Commerce were EUR 869 million in 2010, compared to EUR 756 million in
2009. The year-on-year increase in net sales was primarily driven by growth in mobile device sales,
particularly Nokia mobile devices, improved sales of map licenses to mobile device customers, as well
as improved conditions and higher navigation uptake rates in the automotive industry.
Gross Margin
Location & Commerce gross profit was EUR 700 million in 2010, compared to EUR 625 million in 2009,
with a gross margin of 80.6%, compared to 82.7% in 2009. The lower gross margin in 2010 was
primarily due to changes in our net sales mix.
133