Nokia 2011 Annual Report Download - page 275
Download and view the complete annual report
Please find page 275 of the 2011 Nokia annual report below. You can navigate through the pages in the report by either clicking on the pages listed below, or by using the keyword search tool below to find specific information within the annual report.-
 1
1 -
2
-
3
-
4
-
5
-
6
-
7
-
8
-
9
-
10
-
11
-
12
-
13
-
14
-
15
-
16
-
17
-
18
-
19
-
20
-
21
-
22
-
23
-
24
-
25
-
26
-
27
-
28
-
29
-
30
-
31
-
32
-
33
-
34
-
35
-
36
-
37
-
38
-
39
-
40
-
41
-
42
-
43
-
44
-
45
-
46
-
47
-
48
-
49
-
50
-
51
-
52
-
53
-
54
-
55
-
56
-
57
-
58
-
59
-
60
-
61
-
62
-
63
-
64
-
65
-
66
-
67
-
68
-
69
-
70
-
71
-
72
-
73
-
74
-
75
-
76
-
77
-
78
-
79
-
80
-
81
-
82
-
83
-
84
-
85
-
86
-
87
-
88
-
89
-
90
-
91
-
92
-
93
-
94
-
95
-
96
-
97
-
98
-
99
-
100
-
101
-
102
-
103
-
104
-
105
-
106
-
107
-
108
-
109
-
110
-
111
-
112
-
113
-
114
-
115
-
116
-
117
-
118
-
119
-
120
-
121
-
122
-
123
-
124
-
125
-
126
-
127
-
128
-
129
-
130
-
131
-
132
-
133
-
134
-
135
-
136
-
137
-
138
-
139
-
140
-
141
-
142
-
143
-
144
-
145
-
146
-
147
-
148
-
149
-
150
-
151
-
152
-
153
-
154
-
155
-
156
-
157
-
158
-
159
-
160
-
161
-
162
-
163
-
164
-
165
-
166
-
167
-
168
-
169
-
170
-
171
-
172
-
173
-
174
-
175
-
176
-
177
-
178
-
179
-
180
-
181
-
182
-
183
-
184
-
185
-
186
-
187
-
188
-
189
-
190
-
191
-
192
-
193
-
194
-
195
-
196
-
197
-
198
-
199
-
200
-
201
-
202
-
203
-
204
-
205
-
206
-
207
-
208
-
209
-
210
-
211
-
212
-
213
-
214
-
215
-
216
-
217
-
218
-
219
-
220
-
221
-
222
-
223
-
224
-
225
-
226
-
227
-
228
-
229
-
230
-
231
-
232
-
233
-
234
-
235
-
236
-
237
-
238
-
239
-
240
-
241
-
242
-
243
-
244
-
245
-
246
-
247
-
248
-
249
-
250
-
251
-
252
-
253
-
254
-
255
-
256
-
257
-
258
-
259
-
260
-
261
-
262
-
263
-
264
-
 265
265 -
 266
266 -
 267
267 -
 268
268 -
 269
269 -
 270
270 -
 271
271 -
 272
272 -
 273
273 -
 274
274 -
 275
275 -
 276
276 -
 277
277 -
 278
278 -
 279
279 -
 280
280 -
 281
281 -
 282
282 -
 283
283 -
 284
284 -
 285
285 -
286
-
287
-
288
-
289
-
290
-
291
-
292
-
293
-
294
-
295
-
296
 |
 |

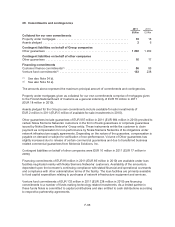
Provisions for losses on projects in progress are related to Nokia Siemens Networks’ onerous
contracts. Utilization of provisions for project losses is generally expected to occur in the next
18 months.
The IPR provision is based on estimated future settlements for asserted and unasserted past IPR
infringements. Final resolution of IPR claims generally occurs over several periods.
Other provisions include provisions for non-cancellable purchase commitments, product portfolio
provisions for the alignment of the product portfolio and related replacement of discontinued products
in customer sites and provision for pension and other social security costs on share-based awards.
28. Earnings per share
2011 2010 2009
Numerator/EURm
Basic/Diluted:
Profit attributable to equity holders of the parent ....... (1 164) 1 850 891
Denominator/1000 shares
Basic:
Weighted average shares ......................... 3 709 947 3 708 816 3 705 116
Effect of dilutive securities: .........................
Performance shares .......................... —324 9 614
Restricted shares ............................ —4 110 6 341
Stock options ................................ ——1
—4 434 15 956
Diluted:
Adjusted weighted average shares and assumed
conversions ................................... 3 709 947 3 713 250 3 721 072
Under IAS 33, basic earnings per share is computed using the weighted average number of shares
outstanding during the period. Diluted earnings per share is computed using the weighted average
number of shares outstanding during the period plus the dilutive effect of stock options, restricted
shares and performance shares outstanding during the period.
In 2011, stock options equivalent to 16 million shares (13 million in 2010 and 12 million in 2009) were
excluded from the calculation of diluted earnings per share because they were determined to be
anti-dilutive.
In addition, 2 million of performance shares were excluded from the calculation of dilutive shares
because contingency conditions have not been met.
As at 31 December 2011, there were 7 million of restricted shares outstanding that could potentially
have a dilutive impact in the future but were excluded from the calculation.
F-65