Nokia 2011 Annual Report Download - page 123
Download and view the complete annual report
Please find page 123 of the 2011 Nokia annual report below. You can navigate through the pages in the report by either clicking on the pages listed below, or by using the keyword search tool below to find specific information within the annual report.-
 1
1 -
2
-
3
-
4
-
5
-
6
-
7
-
8
-
9
-
10
-
11
-
12
-
13
-
14
-
15
-
16
-
17
-
18
-
19
-
20
-
21
-
22
-
23
-
24
-
25
-
26
-
27
-
28
-
29
-
30
-
31
-
32
-
33
-
34
-
35
-
36
-
37
-
38
-
39
-
40
-
41
-
42
-
43
-
44
-
45
-
46
-
47
-
48
-
49
-
50
-
51
-
52
-
53
-
54
-
55
-
56
-
57
-
58
-
59
-
60
-
61
-
62
-
63
-
64
-
65
-
66
-
67
-
68
-
69
-
70
-
71
-
72
-
73
-
74
-
75
-
76
-
77
-
78
-
79
-
80
-
81
-
82
-
83
-
84
-
85
-
86
-
87
-
88
-
89
-
90
-
91
-
92
-
93
-
94
-
95
-
96
-
97
-
98
-
99
-
100
-
101
-
102
-
103
-
104
-
105
-
106
-
107
-
108
-
109
-
110
-
111
-
112
-
 113
113 -
 114
114 -
 115
115 -
 116
116 -
 117
117 -
 118
118 -
 119
119 -
 120
120 -
 121
121 -
 122
122 -
 123
123 -
 124
124 -
 125
125 -
 126
126 -
 127
127 -
 128
128 -
 129
129 -
 130
130 -
 131
131 -
 132
132 -
 133
133 -
134
-
135
-
136
-
137
-
138
-
139
-
140
-
141
-
142
-
143
-
144
-
145
-
146
-
147
-
148
-
149
-
150
-
151
-
152
-
153
-
154
-
155
-
156
-
157
-
158
-
159
-
160
-
161
-
162
-
163
-
164
-
165
-
166
-
167
-
168
-
169
-
170
-
171
-
172
-
173
-
174
-
175
-
176
-
177
-
178
-
179
-
180
-
181
-
182
-
183
-
184
-
185
-
186
-
187
-
188
-
189
-
190
-
191
-
192
-
193
-
194
-
195
-
196
-
197
-
198
-
199
-
200
-
201
-
202
-
203
-
204
-
205
-
206
-
207
-
208
-
209
-
210
-
211
-
212
-
213
-
214
-
215
-
216
-
217
-
218
-
219
-
220
-
221
-
222
-
223
-
224
-
225
-
226
-
227
-
228
-
229
-
230
-
231
-
232
-
233
-
234
-
235
-
236
-
237
-
238
-
239
-
240
-
241
-
242
-
243
-
244
-
245
-
246
-
247
-
248
-
249
-
250
-
251
-
252
-
253
-
254
-
255
-
256
-
257
-
258
-
259
-
260
-
261
-
262
-
263
-
264
-
265
-
266
-
267
-
268
-
269
-
270
-
271
-
272
-
273
-
274
-
275
-
276
-
277
-
278
-
279
-
280
-
281
-
282
-
283
-
284
-
285
-
286
-
287
-
288
-
289
-
290
-
291
-
292
-
293
-
294
-
295
-
296
 |
 |

Average Selling Price
Smart Devices ASP decreased 3% to EUR 140 in 2011, compared to EUR 144 in 2010. The
year-on-year decline in our Smart Devices ASP in 2011 was driven primarily by price actions due to the
competitive environment and the negative impact from foreign currency hedging, partially offset by a
positive mix shift towards higher priced smartphones, such as the Nokia N8, Nokia N9 and Lumia
devices, and the lower deferral of revenue related to services sold in combination with our devices,
particularly in the second half of 2011.
Although Smart Devices ASP declined progressively during the first three quarters of 2011, Smart
Devices ASP increased sequentially in the fourth quarter of 2011, supported by sales of the higher
priced Nokia N9 and Nokia Lumia devices.
Gross Margin
Smart Devices gross margin was 23.7% in 2011, down from 30.8% in 2010. The year-on-year decline
in our Smart Devices gross margin in 2011 was driven primarily by greater price erosion than cost
erosion due to the competitive environment, our tactical pricing actions during the second and third
quarters of 2011 and an increase in Symbian-related allowances during the fourth quarter of 2011.
Following the announcement of our partnership with Microsoft in February 2011, we expected to sell
approximately 150 million more Symbian devices in the years to come. However, changing market
conditions have put increasing pressure on Symbian and contributed to a faster decline of our Symbian
volumes than we anticipated. We expect this trend to continue in 2012. As a result of the changing
market conditions, combined with our increased focus on Lumia, we believe we will sell fewer Symbian
devices than previously anticipated. Thus, in the fourth quarter 2011, we recognized allowances
related to excess component inventory and future purchase commitments, and we may need to
recognize additional allowances in the future.
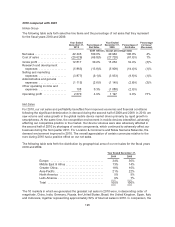
Mobile Phones
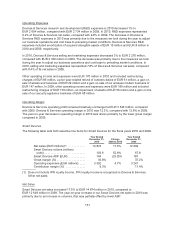
The following table sets forth selective line items for Mobile Phones for the fiscal years 2011 and 2010.
Year Ended
December 31,
2011
Change
2010 to 2011
Year Ended
December 31,
2010
Net sales (EUR millions)(1) ........... 11930 (13)% 13 696
Mobile Phones volume (millions
units) ........................... 339.8 (3)% 349.2
Mobile Phones ASP (EUR) ........... 35 (10)% 39
Gross margin (%) ................... 26.1% 28.0%
Operating expenses (EUR millions) .... 1640 9% 1508
Contribution margin (%) ............. 12.4% 17.0%
(1) Does not include IPR royalty income. IPR royalty income is recognized in Devices & Services
Other net sales.
Net Sales
Mobile Phones net sales decreased 13% to EUR 11 930 million in 2011, compared to EUR 13 696
million in 2010. On a year-on-year basis, our Mobile Phones net sales decrease in 2011 was due to
lower ASPs and, to a lesser extent, lower volumes.
121