Nokia 2011 Annual Report Download - page 180
Download and view the complete annual report
Please find page 180 of the 2011 Nokia annual report below. You can navigate through the pages in the report by either clicking on the pages listed below, or by using the keyword search tool below to find specific information within the annual report.-
 1
1 -
2
-
3
-
4
-
5
-
6
-
7
-
8
-
9
-
10
-
11
-
12
-
13
-
14
-
15
-
16
-
17
-
18
-
19
-
20
-
21
-
22
-
23
-
24
-
25
-
26
-
27
-
28
-
29
-
30
-
31
-
32
-
33
-
34
-
35
-
36
-
37
-
38
-
39
-
40
-
41
-
42
-
43
-
44
-
45
-
46
-
47
-
48
-
49
-
50
-
51
-
52
-
53
-
54
-
55
-
56
-
57
-
58
-
59
-
60
-
61
-
62
-
63
-
64
-
65
-
66
-
67
-
68
-
69
-
70
-
71
-
72
-
73
-
74
-
75
-
76
-
77
-
78
-
79
-
80
-
81
-
82
-
83
-
84
-
85
-
86
-
87
-
88
-
89
-
90
-
91
-
92
-
93
-
94
-
95
-
96
-
97
-
98
-
99
-
100
-
101
-
102
-
103
-
104
-
105
-
106
-
107
-
108
-
109
-
110
-
111
-
112
-
113
-
114
-
115
-
116
-
117
-
118
-
119
-
120
-
121
-
122
-
123
-
124
-
125
-
126
-
127
-
128
-
129
-
130
-
131
-
132
-
133
-
134
-
135
-
136
-
137
-
138
-
139
-
140
-
141
-
142
-
143
-
144
-
145
-
146
-
147
-
148
-
149
-
150
-
151
-
152
-
153
-
154
-
155
-
156
-
157
-
158
-
159
-
160
-
161
-
162
-
163
-
164
-
165
-
166
-
167
-
168
-
169
-
 170
170 -
 171
171 -
 172
172 -
 173
173 -
 174
174 -
 175
175 -
 176
176 -
 177
177 -
 178
178 -
 179
179 -
 180
180 -
 181
181 -
 182
182 -
 183
183 -
 184
184 -
 185
185 -
 186
186 -
 187
187 -
 188
188 -
 189
189 -
 190
190 -
191
-
192
-
193
-
194
-
195
-
196
-
197
-
198
-
199
-
200
-
201
-
202
-
203
-
204
-
205
-
206
-
207
-
208
-
209
-
210
-
211
-
212
-
213
-
214
-
215
-
216
-
217
-
218
-
219
-
220
-
221
-
222
-
223
-
224
-
225
-
226
-
227
-
228
-
229
-
230
-
231
-
232
-
233
-
234
-
235
-
236
-
237
-
238
-
239
-
240
-
241
-
242
-
243
-
244
-
245
-
246
-
247
-
248
-
249
-
250
-
251
-
252
-
253
-
254
-
255
-
256
-
257
-
258
-
259
-
260
-
261
-
262
-
263
-
264
-
265
-
266
-
267
-
268
-
269
-
270
-
271
-
272
-
273
-
274
-
275
-
276
-
277
-
278
-
279
-
280
-
281
-
282
-
283
-
284
-
285
-
286
-
287
-
288
-
289
-
290
-
291
-
292
-
293
-
294
-
295
-
296
 |
 |

Stock
Option
Category
Expiration
Date
Exercise
Price
per
Share
(EUR)
Number of Stock
Options(1)
Total Intrinsic Value of
Stock Options,
December 30, 2011
(EUR)(2)
Name Exercisable Unexercisable Exercisable(3) Unexercisable
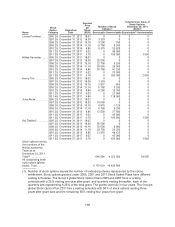
Louise Pentland .....2006 2Q December 31, 2011 18.02 0 0 0 0
2007 2Q December 31, 2012 18.39 3 333 0 0 0
2008 2Q December 31, 2013 19.16 3 250 750 0 0
2009 2Q December 31, 2014 11.18 6 750 5 250 0 0
2010 2Q December 31, 2015 8.86 9 375 20 625 0 0
2011 2Q December 27, 2017 6.02 0 45 000 0 0
2011 3Q December 27, 2017 3.76 0 150 000 0 1 500
Niklas Savander ....2006 2Q December 31, 2011 18.02 0 0 0 0
2007 2Q December 31, 2012 18.39 32 000 0 0 0
2008 2Q December 31, 2013 19.16 22 750 5 250 0 0
2009 2Q December 31, 2014 11.18 30 935 24 065 0 0
2010 2Q December 31, 2015 8.86 18 750 41 250 0 0
2011 2Q December 27, 2017 6.02 0 70 000 0 0
2011 3Q December 27, 2017 3.76 0 200 000 0 2 000
Henry Tirri .........2006 2Q December 31, 2011 18.02 0 0 0 0
2007 2Q December 31, 2012 18.39 1 333 0 0 0
2008 2Q December 31, 2013 19.16 2 837 663 0 0
2009 2Q December 31, 2014 11.18 6 750 5 250 0 0
2010 2Q December 31, 2015 8.86 6 250 13 750 0 0
2011 2Q December 27, 2017 6.02 0 27 000 0 0
2011 4Q December 27, 2017 4.84 0 118 000 0 0
Juha Äkräs .........2006 2Q December 31, 2011 18.02 0 0 0 0
2007 2Q December 31, 2012 18.39 10 000 0 0 0
2008 2Q December 31, 2013 19.16 4 875 1 125 0 0
2009 2Q December 31, 2014 11.18 6 750 5 250 0 0
2010 2Q December 31, 2015 8.86 12 500 27 500 0 0
2011 2Q December 27, 2017 6.02 0 45 000 0 0
2011 3Q December 27, 2017 3.76 0 150 000 0 1 500
Kai Öistämö ........2006 2Q December 31, 2011 18.02 0 0 0 0
2007 2Q December 31, 2012 18.39 55 000 0 0 0
2008 2Q December 31, 2013 19.16 26 000 6 000 0 0
2009 2Q December 31, 2014 11.18 33 750 26 250 0 0
2010 2Q December 31, 2015 8.86 21 875 48 125 0 0
2011 2Q December 27, 2017 6.02 0 45 000 0 0
2011 3Q December 27, 2017 3.76 0 150 000 0 1 500
Stock options held by
the members of the
Nokia Leadership
Team as at
December 31, 2011,
Total(4) ............ 648586 4322363 24050
All outstanding stock
option plans (global
plans), Total ........ 6767629 16435699
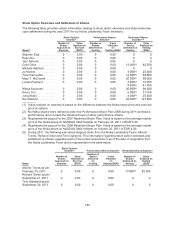
(1) Number of stock options equals the number of underlying shares represented by the option
entitlement. Stock options granted under 2005, 2007 and 2011 Stock Option Plans have different
vesting schedules. The Group’s global Stock Option Plans 2005 and 2007 have a vesting
schedule with a 25% vesting one year after grant, and quarterly vesting thereafter, each of the
quarterly lots representing 6.25% of the total grant. The grants vest fully in four years. The Group’s
global Stock Option Plan 2011 has a vesting schedule with 50% of stock options vesting three
years after grant date and the remaining 50% vesting four years from grant.
178