Nokia 2011 Annual Report Download - page 267
Download and view the complete annual report
Please find page 267 of the 2011 Nokia annual report below. You can navigate through the pages in the report by either clicking on the pages listed below, or by using the keyword search tool below to find specific information within the annual report.-
 1
1 -
2
-
3
-
4
-
5
-
6
-
7
-
8
-
9
-
10
-
11
-
12
-
13
-
14
-
15
-
16
-
17
-
18
-
19
-
20
-
21
-
22
-
23
-
24
-
25
-
26
-
27
-
28
-
29
-
30
-
31
-
32
-
33
-
34
-
35
-
36
-
37
-
38
-
39
-
40
-
41
-
42
-
43
-
44
-
45
-
46
-
47
-
48
-
49
-
50
-
51
-
52
-
53
-
54
-
55
-
56
-
57
-
58
-
59
-
60
-
61
-
62
-
63
-
64
-
65
-
66
-
67
-
68
-
69
-
70
-
71
-
72
-
73
-
74
-
75
-
76
-
77
-
78
-
79
-
80
-
81
-
82
-
83
-
84
-
85
-
86
-
87
-
88
-
89
-
90
-
91
-
92
-
93
-
94
-
95
-
96
-
97
-
98
-
99
-
100
-
101
-
102
-
103
-
104
-
105
-
106
-
107
-
108
-
109
-
110
-
111
-
112
-
113
-
114
-
115
-
116
-
117
-
118
-
119
-
120
-
121
-
122
-
123
-
124
-
125
-
126
-
127
-
128
-
129
-
130
-
131
-
132
-
133
-
134
-
135
-
136
-
137
-
138
-
139
-
140
-
141
-
142
-
143
-
144
-
145
-
146
-
147
-
148
-
149
-
150
-
151
-
152
-
153
-
154
-
155
-
156
-
157
-
158
-
159
-
160
-
161
-
162
-
163
-
164
-
165
-
166
-
167
-
168
-
169
-
170
-
171
-
172
-
173
-
174
-
175
-
176
-
177
-
178
-
179
-
180
-
181
-
182
-
183
-
184
-
185
-
186
-
187
-
188
-
189
-
190
-
191
-
192
-
193
-
194
-
195
-
196
-
197
-
198
-
199
-
200
-
201
-
202
-
203
-
204
-
205
-
206
-
207
-
208
-
209
-
210
-
211
-
212
-
213
-
214
-
215
-
216
-
217
-
218
-
219
-
220
-
221
-
222
-
223
-
224
-
225
-
226
-
227
-
228
-
229
-
230
-
231
-
232
-
233
-
234
-
235
-
236
-
237
-
238
-
239
-
240
-
241
-
242
-
243
-
244
-
245
-
246
-
247
-
248
-
249
-
250
-
251
-
252
-
253
-
254
-
255
-
256
-
 257
257 -
 258
258 -
 259
259 -
 260
260 -
 261
261 -
 262
262 -
 263
263 -
 264
264 -
 265
265 -
 266
266 -
 267
267 -
 268
268 -
 269
269 -
 270
270 -
 271
271 -
 272
272 -
 273
273 -
 274
274 -
 275
275 -
 276
276 -
 277
277 -
278
-
279
-
280
-
281
-
282
-
283
-
284
-
285
-
286
-
287
-
288
-
289
-
290
-
291
-
292
-
293
-
294
-
295
-
296
 |
 |

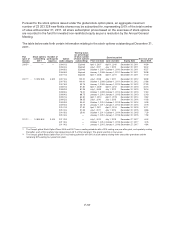
Pursuant to the stock options issued under the global stock option plans, an aggregate maximum
number of 23 203 328 new Nokia shares may be subscribed for, representing 0,6% of the total number
of votes at December 31, 2011. All share subscription prices based on the exercises of stock options
are recorded in the fund for invested non-restricted equity as per a resolution by the Annual General
Meeting.
The table below sets forth certain information relating to the stock options outstanding at December 31,
2011.
Plan
(year of
launch)
Stock options
outstanding
2011
Number of
participants
(approx.)
Option
(sub) category
Vesting status
(as percentage
of total number
of stock options
outstanding)
Exercise period Exercise price/
Share EURFirst vest date Last vest date Expiry date
2005 (1) . . — — 2006 1Q Expired April 1, 2007 April 1, 2010 December 31, 2011 14.99
2006 2Q Expired July 1, 2007 July 1, 2010 December 31, 2011 18.02
2006 3Q Expired October 1, 2007 October 1, 2010 December 31, 2011 15.37
2006 4Q Expired January 1, 2008 January 1, 2011 December 31, 2011 15.38
2007 1Q Expired April 1, 2008 April 1, 2011 December 31, 2011 17.00
2007 (1) . . 12 352 526 4 600 2007 2Q 100.00 July 1, 2008 July 1, 2011 December 31, 2012 18.39
2007 3Q 100.00 October 1, 2008 October 1, 2011 December 31, 2012 21.86
2007 4Q 93.75 January 1, 2009 January 1, 2012 December 31, 2012 27.53
2008 1Q 87.50 April 1, 2009 April 1, 2012 December 31, 2013 24.15
2008 2Q 81.25 July 1, 2009 July 1, 2012 December 31, 2013 19.16
2008 3Q 75.00 October 1, 2009 October 1, 2012 December 31, 2013 17.80
2008 4Q 68.75 January 1, 2010 January 1, 2013 December 31, 2013 12.43
2009 1Q 62.50 April 1, 2010 April 1, 2013 December 31, 2014 9.82
2009 2Q 56.25 July 1, 2010 July 1, 2013 December 31, 2014 11.18
2009 3Q 50.00 October 1, 2010 October 1, 2013 December 31, 2014 9.28
2009 4Q 43.75 January 1, 2011 January 1, 2014 December 31, 2014 8.76
2010 1Q 37.50 April 1, 2011 April 1, 2014 December 31, 2015 10.11
2010 2Q 31.25 July 1, 2011 July 1, 2014 December 31, 2015 8.86
2010 3Q 25.00 October 1, 2011 October 1, 2014 December 31, 2015 7.29
2010 4Q — January 1, 2012 January 1, 2015 December 31, 2015 7.59
2011(2) . . . 10 850 802 3 000 2011 2Q — July 1, 2014 July 1, 2015 December 27, 2017 6.02
2011 3Q — October 1, 2014 October 1, 2015 December 27, 2017 3.76
2011 4Q — January 1, 2015 January 1, 2016 December 27, 2017 4.84
(1) The Group’s global Stock Option Plans 2005 and 2007 have a vesting schedule with a 25% vesting one year after grant, and quarterly vesting
thereafter, each of the quarterly lots representing 6.25 % of the total grant. The grants vest fully in four years.
(2) The Group’s global Stock Option Plan 2011 has vesting schedule with 50% of stock options vesting three years after grant date and the
remaining 50% vesting four years from grant.
F-57