Nokia 2011 Annual Report Download - page 131
Download and view the complete annual report
Please find page 131 of the 2011 Nokia annual report below. You can navigate through the pages in the report by either clicking on the pages listed below, or by using the keyword search tool below to find specific information within the annual report.-
 1
1 -
2
-
3
-
4
-
5
-
6
-
7
-
8
-
9
-
10
-
11
-
12
-
13
-
14
-
15
-
16
-
17
-
18
-
19
-
20
-
21
-
22
-
23
-
24
-
25
-
26
-
27
-
28
-
29
-
30
-
31
-
32
-
33
-
34
-
35
-
36
-
37
-
38
-
39
-
40
-
41
-
42
-
43
-
44
-
45
-
46
-
47
-
48
-
49
-
50
-
51
-
52
-
53
-
54
-
55
-
56
-
57
-
58
-
59
-
60
-
61
-
62
-
63
-
64
-
65
-
66
-
67
-
68
-
69
-
70
-
71
-
72
-
73
-
74
-
75
-
76
-
77
-
78
-
79
-
80
-
81
-
82
-
83
-
84
-
85
-
86
-
87
-
88
-
89
-
90
-
91
-
92
-
93
-
94
-
95
-
96
-
97
-
98
-
99
-
100
-
101
-
102
-
103
-
104
-
105
-
106
-
107
-
108
-
109
-
110
-
111
-
112
-
113
-
114
-
115
-
116
-
117
-
118
-
119
-
120
-
 121
121 -
 122
122 -
 123
123 -
 124
124 -
 125
125 -
 126
126 -
 127
127 -
 128
128 -
 129
129 -
 130
130 -
 131
131 -
 132
132 -
 133
133 -
 134
134 -
 135
135 -
 136
136 -
 137
137 -
 138
138 -
 139
139 -
 140
140 -
 141
141 -
142
-
143
-
144
-
145
-
146
-
147
-
148
-
149
-
150
-
151
-
152
-
153
-
154
-
155
-
156
-
157
-
158
-
159
-
160
-
161
-
162
-
163
-
164
-
165
-
166
-
167
-
168
-
169
-
170
-
171
-
172
-
173
-
174
-
175
-
176
-
177
-
178
-
179
-
180
-
181
-
182
-
183
-
184
-
185
-
186
-
187
-
188
-
189
-
190
-
191
-
192
-
193
-
194
-
195
-
196
-
197
-
198
-
199
-
200
-
201
-
202
-
203
-
204
-
205
-
206
-
207
-
208
-
209
-
210
-
211
-
212
-
213
-
214
-
215
-
216
-
217
-
218
-
219
-
220
-
221
-
222
-
223
-
224
-
225
-
226
-
227
-
228
-
229
-
230
-
231
-
232
-
233
-
234
-
235
-
236
-
237
-
238
-
239
-
240
-
241
-
242
-
243
-
244
-
245
-
246
-
247
-
248
-
249
-
250
-
251
-
252
-
253
-
254
-
255
-
256
-
257
-
258
-
259
-
260
-
261
-
262
-
263
-
264
-
265
-
266
-
267
-
268
-
269
-
270
-
271
-
272
-
273
-
274
-
275
-
276
-
277
-
278
-
279
-
280
-
281
-
282
-
283
-
284
-
285
-
286
-
287
-
288
-
289
-
290
-
291
-
292
-
293
-
294
-
295
-
296
 |
 |

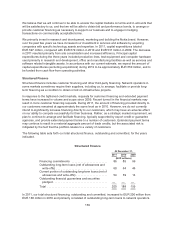
Results by Segments
Devices & Services
The following table sets forth selective line items and the percentage of net sales that they represent
for Devices & Services for the fiscal years 2010 and 2009.
Year Ended
December 31,
2010
Percentage of
Net Sales
Year Ended
December 31,
2009
Percentage of
Net Sales
Percentage
Increase/
(Decrease)
(EUR millions, except percentage data)
Net sales ..................... 29134 100.0% 27 853 100.0% 5%
Cost of sales ................. (20412) (70.1)% (18 626) (66.9)% 10%
Gross profit ................... 8722 29.9% 9 227 33.1% (5)%
Research and development
expenses .................. (2694) (9.2)% (2 734) (9.8)% (1)%
Selling and marketing
expenses .................. (2270) (7.8)% (2 330) (8.4)% (3)%
Administrative and general
expenses .................. (388) (1.3)% (409) (1.5)% (5)%
Other operating income and
expenses .................. 170 0.6% (189) (0.7)%
Operating profit ............... 3540 12.2% 3 564 12.8% (1)%
Net Sales
The following table sets forth our Devices & Services net sales and year-on-year growth rate by
geographic area for the fiscal years 2010 and 2009.
Year Ended
December 31,
2010
Change
2009 to 2010
Year Ended
December 31,
2009
(EUR millions, except percentage data)
Europe ........................... 9736 (2)% 9 890
Middle East & Africa ................ 4046 3% 3923
Greater China ...................... 6167 23% 5028
Asia-Pacific ........................ 6014 (3)% 6 230
North America ..................... 901 (12)% 1 020
Latin America ...................... 2270 29% 1762
Total ............................. 29134 5% 27853
The 5% year-on-year increase in Devices & Services net sales in 2010 resulted principally as a result
of higher volumes and a flat average selling price (ASP), as well as the overall appreciation of certain
currencies against the euro during 2010, and a smaller negative foreign exchange hedging impact
compared with 2009. Of our total Devices & Services net sales, services contributed EUR 667 million
in 2010, compared with EUR 592 million in 2009.
129