Nokia 2011 Annual Report Download - page 128
Download and view the complete annual report
Please find page 128 of the 2011 Nokia annual report below. You can navigate through the pages in the report by either clicking on the pages listed below, or by using the keyword search tool below to find specific information within the annual report.-
 1
1 -
2
-
3
-
4
-
5
-
6
-
7
-
8
-
9
-
10
-
11
-
12
-
13
-
14
-
15
-
16
-
17
-
18
-
19
-
20
-
21
-
22
-
23
-
24
-
25
-
26
-
27
-
28
-
29
-
30
-
31
-
32
-
33
-
34
-
35
-
36
-
37
-
38
-
39
-
40
-
41
-
42
-
43
-
44
-
45
-
46
-
47
-
48
-
49
-
50
-
51
-
52
-
53
-
54
-
55
-
56
-
57
-
58
-
59
-
60
-
61
-
62
-
63
-
64
-
65
-
66
-
67
-
68
-
69
-
70
-
71
-
72
-
73
-
74
-
75
-
76
-
77
-
78
-
79
-
80
-
81
-
82
-
83
-
84
-
85
-
86
-
87
-
88
-
89
-
90
-
91
-
92
-
93
-
94
-
95
-
96
-
97
-
98
-
99
-
100
-
101
-
102
-
103
-
104
-
105
-
106
-
107
-
108
-
109
-
110
-
111
-
112
-
113
-
114
-
115
-
116
-
117
-
 118
118 -
 119
119 -
 120
120 -
 121
121 -
 122
122 -
 123
123 -
 124
124 -
 125
125 -
 126
126 -
 127
127 -
 128
128 -
 129
129 -
 130
130 -
 131
131 -
 132
132 -
 133
133 -
 134
134 -
 135
135 -
 136
136 -
 137
137 -
 138
138 -
139
-
140
-
141
-
142
-
143
-
144
-
145
-
146
-
147
-
148
-
149
-
150
-
151
-
152
-
153
-
154
-
155
-
156
-
157
-
158
-
159
-
160
-
161
-
162
-
163
-
164
-
165
-
166
-
167
-
168
-
169
-
170
-
171
-
172
-
173
-
174
-
175
-
176
-
177
-
178
-
179
-
180
-
181
-
182
-
183
-
184
-
185
-
186
-
187
-
188
-
189
-
190
-
191
-
192
-
193
-
194
-
195
-
196
-
197
-
198
-
199
-
200
-
201
-
202
-
203
-
204
-
205
-
206
-
207
-
208
-
209
-
210
-
211
-
212
-
213
-
214
-
215
-
216
-
217
-
218
-
219
-
220
-
221
-
222
-
223
-
224
-
225
-
226
-
227
-
228
-
229
-
230
-
231
-
232
-
233
-
234
-
235
-
236
-
237
-
238
-
239
-
240
-
241
-
242
-
243
-
244
-
245
-
246
-
247
-
248
-
249
-
250
-
251
-
252
-
253
-
254
-
255
-
256
-
257
-
258
-
259
-
260
-
261
-
262
-
263
-
264
-
265
-
266
-
267
-
268
-
269
-
270
-
271
-
272
-
273
-
274
-
275
-
276
-
277
-
278
-
279
-
280
-
281
-
282
-
283
-
284
-
285
-
286
-
287
-
288
-
289
-
290
-
291
-
292
-
293
-
294
-
295
-
296
 |
 |

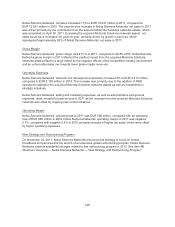
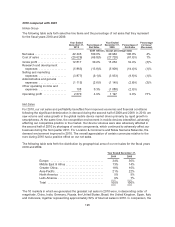
2010 compared with 2009
Nokia Group
The following table sets forth selective line items and the percentage of net sales that they represent
for the fiscal years 2010 and 2009.
Year Ended
December 31,
2010
Percentage of
Net Sales
Year Ended
December 31,
2009
Percentage of
Net Sales
Percentage
Increase/
(Decrease)
(EUR millions, except percentage data)
Net sales ..................... 42446 100.0% 40 984 100.0% 4%
Cost of sales ................. (29629) (69.8)% (27 720) (67.6)% 7%
Gross profit ................... 12817 30.2% 13 264 32.4% (3)%
Research and development
expenses .................. (5863) (13.8)% (5 909) (14.4)% (1)%
Selling and marketing
expenses .................. (3877) (9.1)% (3 933) (9.6)% (1)%
Administrative and general
expenses .................. (1115) (2.6)% (1 145) (2.8)% (3)%
Other operating income and
expenses .................. 108 0.3% (1 080) (2.6)%
Operating profit ............... 2070 4.9% 1 197 2.9% 73%
Net Sales
For 2010, our net sales and profitability benefited from improved economic and financial conditions
following the significant deterioration in demand during the second half of 2008 and 2009. In 2010, we
saw volume and value growth in the global mobile device market driven primarily by rapid growth in
smartphones. At the same time, the competitive environment in mobile devices intensified, adversely
affecting our competitive position in the market. Our device volumes were also adversely affected in
the second half of 2010 by shortages of certain components, which continued to adversely affect our
business during the first quarter 2011. For Location & Commerce and Nokia Siemens Networks, the
demand environment improved in 2010. The overall appreciation of certain currencies relative to the
euro during 2010 had a positive effect on our net sales.
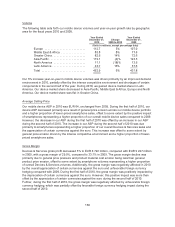
The following table sets forth the distribution by geographical area of our net sales for the fiscal years
2010 and 2009.
Year Ended December 31,
2010 2009
Europe ................................... 34% 36%
Middle East & Africa ......................... 13% 14%
Greater China .............................. 18% 16%
Asia-Pacific ................................ 21% 22%
North America ............................. 5% 5%
Latin America .............................. 9% 7%
Total ..................................... 100% 100%
The 10 markets in which we generated the greatest net sales in 2010 were, in descending order of
magnitude, China, India, Germany, Russia, the United States, Brazil, the United Kingdom, Spain, Italy
and Indonesia, together representing approximately 52% of total net sales in 2010. In comparison, the
126