Nokia 2011 Annual Report Download - page 125
Download and view the complete annual report
Please find page 125 of the 2011 Nokia annual report below. You can navigate through the pages in the report by either clicking on the pages listed below, or by using the keyword search tool below to find specific information within the annual report.-
 1
1 -
2
-
3
-
4
-
5
-
6
-
7
-
8
-
9
-
10
-
11
-
12
-
13
-
14
-
15
-
16
-
17
-
18
-
19
-
20
-
21
-
22
-
23
-
24
-
25
-
26
-
27
-
28
-
29
-
30
-
31
-
32
-
33
-
34
-
35
-
36
-
37
-
38
-
39
-
40
-
41
-
42
-
43
-
44
-
45
-
46
-
47
-
48
-
49
-
50
-
51
-
52
-
53
-
54
-
55
-
56
-
57
-
58
-
59
-
60
-
61
-
62
-
63
-
64
-
65
-
66
-
67
-
68
-
69
-
70
-
71
-
72
-
73
-
74
-
75
-
76
-
77
-
78
-
79
-
80
-
81
-
82
-
83
-
84
-
85
-
86
-
87
-
88
-
89
-
90
-
91
-
92
-
93
-
94
-
95
-
96
-
97
-
98
-
99
-
100
-
101
-
102
-
103
-
104
-
105
-
106
-
107
-
108
-
109
-
110
-
111
-
112
-
113
-
114
-
 115
115 -
 116
116 -
 117
117 -
 118
118 -
 119
119 -
 120
120 -
 121
121 -
 122
122 -
 123
123 -
 124
124 -
 125
125 -
 126
126 -
 127
127 -
 128
128 -
 129
129 -
 130
130 -
 131
131 -
 132
132 -
 133
133 -
 134
134 -
 135
135 -
136
-
137
-
138
-
139
-
140
-
141
-
142
-
143
-
144
-
145
-
146
-
147
-
148
-
149
-
150
-
151
-
152
-
153
-
154
-
155
-
156
-
157
-
158
-
159
-
160
-
161
-
162
-
163
-
164
-
165
-
166
-
167
-
168
-
169
-
170
-
171
-
172
-
173
-
174
-
175
-
176
-
177
-
178
-
179
-
180
-
181
-
182
-
183
-
184
-
185
-
186
-
187
-
188
-
189
-
190
-
191
-
192
-
193
-
194
-
195
-
196
-
197
-
198
-
199
-
200
-
201
-
202
-
203
-
204
-
205
-
206
-
207
-
208
-
209
-
210
-
211
-
212
-
213
-
214
-
215
-
216
-
217
-
218
-
219
-
220
-
221
-
222
-
223
-
224
-
225
-
226
-
227
-
228
-
229
-
230
-
231
-
232
-
233
-
234
-
235
-
236
-
237
-
238
-
239
-
240
-
241
-
242
-
243
-
244
-
245
-
246
-
247
-
248
-
249
-
250
-
251
-
252
-
253
-
254
-
255
-
256
-
257
-
258
-
259
-
260
-
261
-
262
-
263
-
264
-
265
-
266
-
267
-
268
-
269
-
270
-
271
-
272
-
273
-
274
-
275
-
276
-
277
-
278
-
279
-
280
-
281
-
282
-
283
-
284
-
285
-
286
-
287
-
288
-
289
-
290
-
291
-
292
-
293
-
294
-
295
-
296
 |
 |

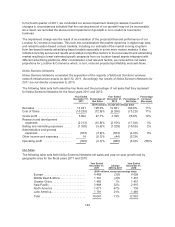
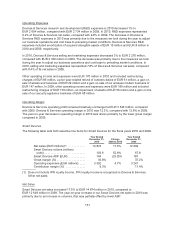
Net Sales
The following table sets forth Location & Commerce net sales and year-on-year growth rate by
geographic area for the fiscal years 2011 and 2010.
Year Ended
December 31,
2011
Change
2010 to 2011
Year Ended
December 31,
2010
(EUR millions, except percentage data)
Europe ........................... 488 28% 380
Middle East & Africa ................ 74 68% 44
Greater China ...................... 128 125% 57
Asia-Pacific ........................ 74 48% 50
North America ..................... 284 (12)% 322
Latin America ...................... 43 169% 16
Total ............................. 1091 26% 869
Location & Commerce net sales increased 26% to EUR 1 091 million in 2011, compared to
EUR 869 million in 2010. The year-on-year increase in net sales in 2011 was primarily driven by higher
sales of map content licenses to vehicle customers due to increased consumer uptake of navigation
systems and higher recognition of deferred revenue related to sales of map platform licenses to Smart
Devices.
Gross Margin
On a year-on-year basis the gross margin in Location & Commerce was virtually unchanged. In 2011,
the gross margin benefited from an increased proportion of higher gross margin sales compared to
2010, which were offset by a reclassification of certain data related charges from operating expenditure
to cost of sales in the fourth quarter of 2011.
Operating Expenses
Location & Commerce research and development expenses decreased 5% to EUR 958 million,
compared to EUR 1 011 million in 2010. The decrease was primarily driven by a focus on cost controls,
lower project spending and a shift of research and development operating expenses to cost of sales as
a result of the divestiture of the media advertising business.
Location & Commerce selling and marketing expenses decreased 5% to EUR 259 million, compared to
EUR 274 million in 2010. The decrease was primarily driven by a focus on cost controls and lower
product marketing spending.
Location & Commerce administrative and general expenses decreased 9% to EUR 68 million,
compared to EUR 75 million in 2010. The decrease was primarily driven by a focus on cost controls,
partially offset by increased depreciation costs related to closure of offices.
Operating Margin
Location & Commerce operating loss increased to EUR 1 526 million in 2011, compared with a loss of
EUR 663 million in 2010. Location & Commerce operating margin in 2011 was negative 139.9%,
compared with negative 76.3% in 2010. The year-on-year decrease in operating margin in 2011 was
driven primarily by the higher other operating expenses due to the impairment of Location &
Commerce’s goodwill of EUR 1.1 billion offset to some extent by higher net sales and lower operating
expenses compared to 2010.
123