Nokia 2011 Annual Report Download - page 218
Download and view the complete annual report
Please find page 218 of the 2011 Nokia annual report below. You can navigate through the pages in the report by either clicking on the pages listed below, or by using the keyword search tool below to find specific information within the annual report.-
 1
1 -
2
-
3
-
4
-
5
-
6
-
7
-
8
-
9
-
10
-
11
-
12
-
13
-
14
-
15
-
16
-
17
-
18
-
19
-
20
-
21
-
22
-
23
-
24
-
25
-
26
-
27
-
28
-
29
-
30
-
31
-
32
-
33
-
34
-
35
-
36
-
37
-
38
-
39
-
40
-
41
-
42
-
43
-
44
-
45
-
46
-
47
-
48
-
49
-
50
-
51
-
52
-
53
-
54
-
55
-
56
-
57
-
58
-
59
-
60
-
61
-
62
-
63
-
64
-
65
-
66
-
67
-
68
-
69
-
70
-
71
-
72
-
73
-
74
-
75
-
76
-
77
-
78
-
79
-
80
-
81
-
82
-
83
-
84
-
85
-
86
-
87
-
88
-
89
-
90
-
91
-
92
-
93
-
94
-
95
-
96
-
97
-
98
-
99
-
100
-
101
-
102
-
103
-
104
-
105
-
106
-
107
-
108
-
109
-
110
-
111
-
112
-
113
-
114
-
115
-
116
-
117
-
118
-
119
-
120
-
121
-
122
-
123
-
124
-
125
-
126
-
127
-
128
-
129
-
130
-
131
-
132
-
133
-
134
-
135
-
136
-
137
-
138
-
139
-
140
-
141
-
142
-
143
-
144
-
145
-
146
-
147
-
148
-
149
-
150
-
151
-
152
-
153
-
154
-
155
-
156
-
157
-
158
-
159
-
160
-
161
-
162
-
163
-
164
-
165
-
166
-
167
-
168
-
169
-
170
-
171
-
172
-
173
-
174
-
175
-
176
-
177
-
178
-
179
-
180
-
181
-
182
-
183
-
184
-
185
-
186
-
187
-
188
-
189
-
190
-
191
-
192
-
193
-
194
-
195
-
196
-
197
-
198
-
199
-
200
-
201
-
202
-
203
-
204
-
205
-
206
-
207
-
 208
208 -
 209
209 -
 210
210 -
 211
211 -
 212
212 -
 213
213 -
 214
214 -
 215
215 -
 216
216 -
 217
217 -
 218
218 -
 219
219 -
 220
220 -
 221
221 -
 222
222 -
 223
223 -
 224
224 -
 225
225 -
 226
226 -
 227
227 -
 228
228 -
229
-
230
-
231
-
232
-
233
-
234
-
235
-
236
-
237
-
238
-
239
-
240
-
241
-
242
-
243
-
244
-
245
-
246
-
247
-
248
-
249
-
250
-
251
-
252
-
253
-
254
-
255
-
256
-
257
-
258
-
259
-
260
-
261
-
262
-
263
-
264
-
265
-
266
-
267
-
268
-
269
-
270
-
271
-
272
-
273
-
274
-
275
-
276
-
277
-
278
-
279
-
280
-
281
-
282
-
283
-
284
-
285
-
286
-
287
-
288
-
289
-
290
-
291
-
292
-
293
-
294
-
295
-
296
 |
 |

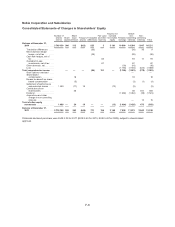
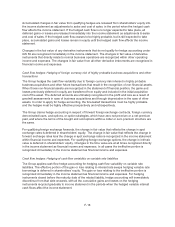
Nokia Corporation and Subsidiaries
Consolidated Statements of Changes in Shareholders’ Equity
Number of
shares
(000’s) Share
capital
Share
issue
premium Treasury
shares Translation
differences
Fair value
and other
reserves
Reserve for
invested
non-restrict.
equity Retained
earnings
Before
non-
controlling
interests
Non-
controlling
interests Total
Balance at December 31,
2010 ......................3 709 130 246 312 (663) 825 3 3 161 10 500 14 384 1 847 16 231
Translation differences ..... (26) (26) 35 9
Net investment hedge
losses, net of tax ........ (28) (28) (28)
Cash flow hedges, net of
tax .................... 84 84 10 94
Available-for-sale
investments, net of tax . . . 67 67 67
Other decrease, net ........ (16) (16) (16)
Loss .................... (1164) (1164) (324) (1488)
Total comprehensive income ... — — — (54) 151 — (1 180) (1 083) (279) (1 362)
Stock options exercised .... ——
Share-based
compensation .......... 18 18 18
Excess tax benefit on share-
based compensation ..... (3) (3) (1) (4)
Settlement of performance
and restricted shares ..... 1059 (11) 19 (13) (5) (5)
Contributions from
shareholders ........... 46 46 500 546
Dividend ................. (1484) (1484) (39) (1523)
Acquisitions and other
change in non-controlling
interests ............... —1515
Total of other equity
movements ................ 1 059 — 50 19 — — (13) (1 484) (1 428) 475 (953)
Balance at December 31,
2011 ......................3 710 189 246 362 (644) 771 154 3 148 7 836 11 873 2 043 13 916
Dividends declared per share were EUR 0.20 for 2011 (EUR 0.40 for 2010, EUR 0.40 for 2009), subject to shareholders’
approval.
F-8